First Light News: Divided Fed; October cut not a done deal
By FP Markets
Fed Governor Stephen Miran made headlines yesterday in an interview on Bloomberg and essentially doubled down on his dovish stance.
Week ahead: Jackson Hole Symposium on the radar
By FP Markets
We have quite a busy slate of event risk to get our teeth into this week. In addition to the Jackson Hole Symposium, an update from the Reserve Bank of New Zealand (RBNZ) and the minutes from the previous US Federal Reserve (Fed) meeting claim some of the limelight, as well as inflation data, and manufacturing and services S&P Global PMIs (Purchasing Managers’ Indexes).
Levels of the Day
By FP Markets
Today’s Levels of the Day post will focus largely on the bond market, specifically on the long-end of the curve in the UK and the US. Additionally, given its robust run higher, Spot Silver has also made today’s release!
First Light News: Stocks & Bonds down; Gold at all-time highs!
By FP Markets
As both Equity and Bond markets retreated in synchronised fashion yesterday, the 60/40 portfolio allocation strategy faces challenges. The S&P 500 fell 0.7% to 6,415, the Nasdaq 100 dropped 0.8% to 23,231, with the Dow Jones Industrial Average shedding 0.6% to 45,295.
Week ahead: All about the August US jobs data!
By FP Markets
In a holiday-shortened week, all eyes will be on the August US jobs report, particularly after July’s release raised questions.
Week ahead: Jackson Hole Symposium on the radar
By FP Markets
We have quite a busy slate of event risk to get our teeth into this week. In addition to the Jackson Hole Symposium, an update from the Reserve Bank of New Zealand (RBNZ) and the minutes from the previous US Federal Reserve (Fed) meeting claim some of the limelight, as well as inflation data, and manufacturing and services S&P Global PMIs (Purchasing Managers’ Indexes).
Index and Commodities Trading week beginning 11 / 08 / 2025
By FP Markets
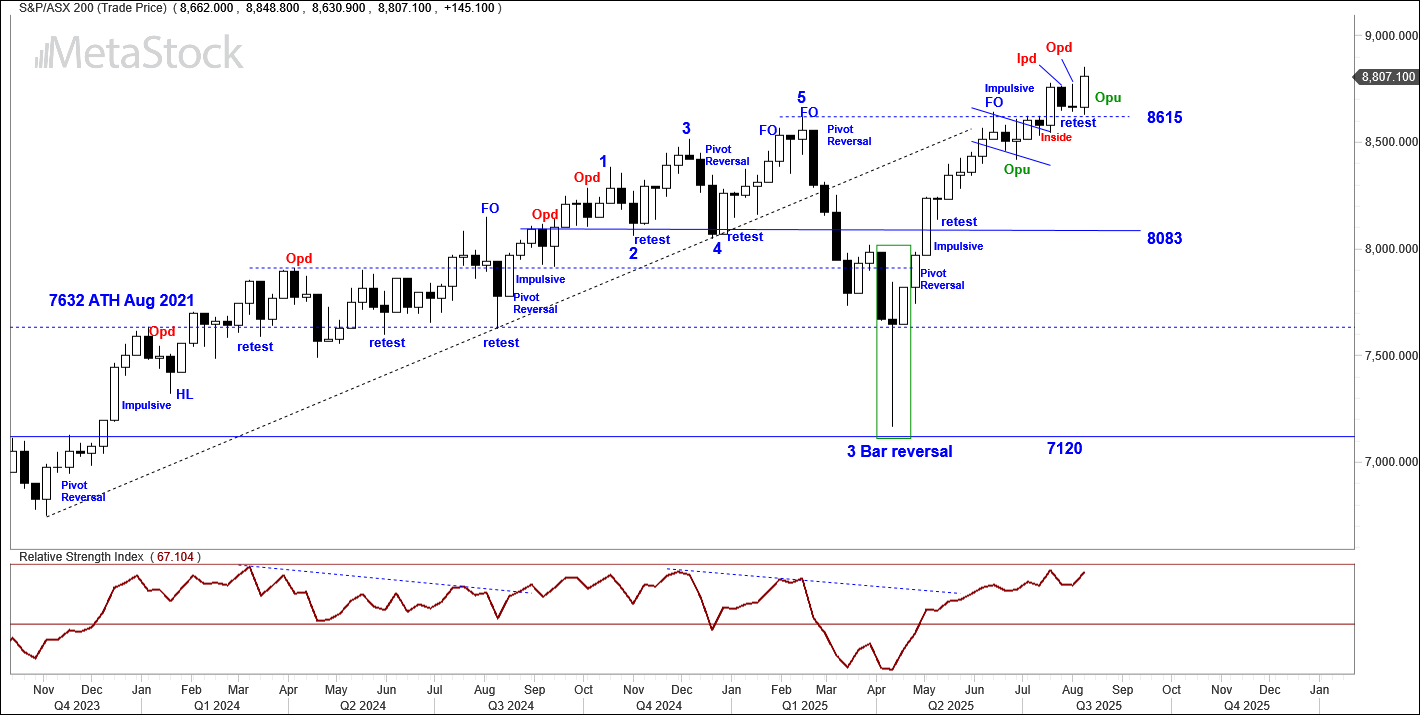
 XJO WEEKLY
Price structure: Outside range
The recent widening of weekly ranges, punctuated by two consecutive Weekly Outside Bars, signals a notable escalation in market indecision and volatility. This pattern reflects a heightened battle between buyers and sellers, each side probing for dominance but failing to secure lasting control, classic signs of a market at a potential inflection point. The support level at 8615 is now a critical hold for the Buyers to remain confident. Currently Company reporting is underway, when the general trend of results is determined traders should expect a volatile breakout from this current consolidation area.
Indicator: Relative strength 14: Momentum on hold
Relative strength has turned higher in line with the current movement in the Index and remains above the key 50 level. Only further movements higher towards the 70 level can set a continuing bullish signal for price movements.
The RSI turning further lower to move below the 50 level, is a strong indication is for negative momentum to develop leading to Up Trend failure and further declines.
XJO WEEKLY
Price structure: Outside range
The recent widening of weekly ranges, punctuated by two consecutive Weekly Outside Bars, signals a notable escalation in market indecision and volatility. This pattern reflects a heightened battle between buyers and sellers, each side probing for dominance but failing to secure lasting control, classic signs of a market at a potential inflection point. The support level at 8615 is now a critical hold for the Buyers to remain confident. Currently Company reporting is underway, when the general trend of results is determined traders should expect a volatile breakout from this current consolidation area.
Indicator: Relative strength 14: Momentum on hold
Relative strength has turned higher in line with the current movement in the Index and remains above the key 50 level. Only further movements higher towards the 70 level can set a continuing bullish signal for price movements.
The RSI turning further lower to move below the 50 level, is a strong indication is for negative momentum to develop leading to Up Trend failure and further declines.
 Comments last week:- The Weekly inside range of 2 weeks ago has been followed by last weeks outside range closing near the low of the range. This presents a bearish setup on a break of 8615 point support. Buyers in the Bullish breakout are now faced with losses should the Index move lower. The next key support level is 8083 points. Although the market is dealing with the Macro news of Tariffs emanating from the US, the developing technical picture is Bearish until a closing price over 8776 points is registered showing buyers back in control.
XJO DAILY
Price structure: Bullish Flag developing
The Daily chart of the XJO200 has carved out a Bullish Reversal Pivot, suggesting the potential for price to break above the recent consolidation range. This pivot is not just a technical marker, it reflects a shift in market sentiment, where buyers are beginning to assert control after a period of equilibrium. Typically forms after a swing low rejection, in this case a retest of the 8615-level last Monday, often accompanied by a strong close near the high of the day as seen last Tuesday and Wednesday. This remains a bullish setup for traders working in the Daily time frame.
Indicator: Relative strength 14: Slowing momentum
The Relative strength Indicator (14) has been declining from price consolidation from below the 70 level and now moving lower indicating a loss of positive momentum within the 14 day look back period. This is typical of the RSI reading when price moves into consolidation. The impending move lower below the 50 level would indicate a loss of positive momentum and a sell signal.
Comments last week:- The Weekly inside range of 2 weeks ago has been followed by last weeks outside range closing near the low of the range. This presents a bearish setup on a break of 8615 point support. Buyers in the Bullish breakout are now faced with losses should the Index move lower. The next key support level is 8083 points. Although the market is dealing with the Macro news of Tariffs emanating from the US, the developing technical picture is Bearish until a closing price over 8776 points is registered showing buyers back in control.
XJO DAILY
Price structure: Bullish Flag developing
The Daily chart of the XJO200 has carved out a Bullish Reversal Pivot, suggesting the potential for price to break above the recent consolidation range. This pivot is not just a technical marker, it reflects a shift in market sentiment, where buyers are beginning to assert control after a period of equilibrium. Typically forms after a swing low rejection, in this case a retest of the 8615-level last Monday, often accompanied by a strong close near the high of the day as seen last Tuesday and Wednesday. This remains a bullish setup for traders working in the Daily time frame.
Indicator: Relative strength 14: Slowing momentum
The Relative strength Indicator (14) has been declining from price consolidation from below the 70 level and now moving lower indicating a loss of positive momentum within the 14 day look back period. This is typical of the RSI reading when price moves into consolidation. The impending move lower below the 50 level would indicate a loss of positive momentum and a sell signal.
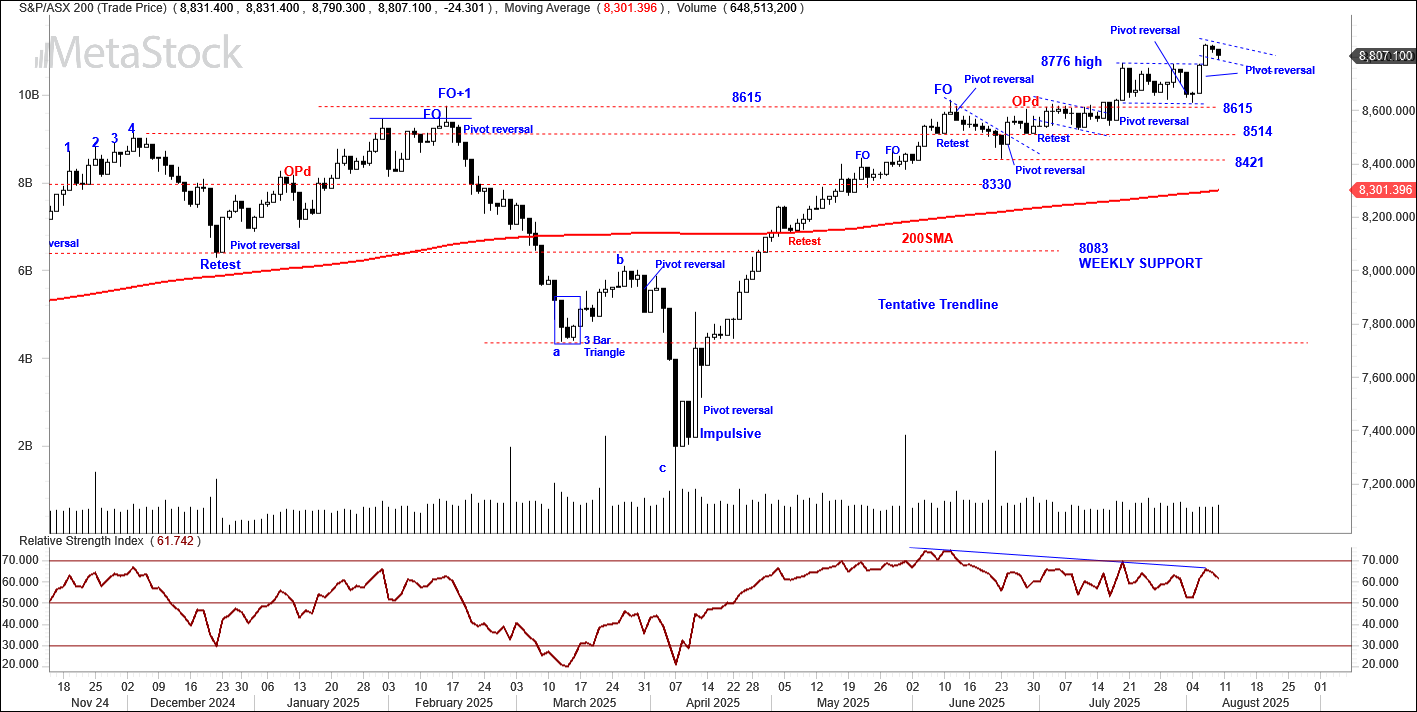 Comments last week. The Pennant continuation pattern discussed last week is now better described as a consolidation range above 8615 and below the 8776 level. Last Friday set a reversal pivot point, an early developing sell signal to be confirmed with a further daily close below 8615 points. The final bar is a large range high to low; this also adds to the bearishness of the setup and the potential to retest the 8514 level during this trading week.
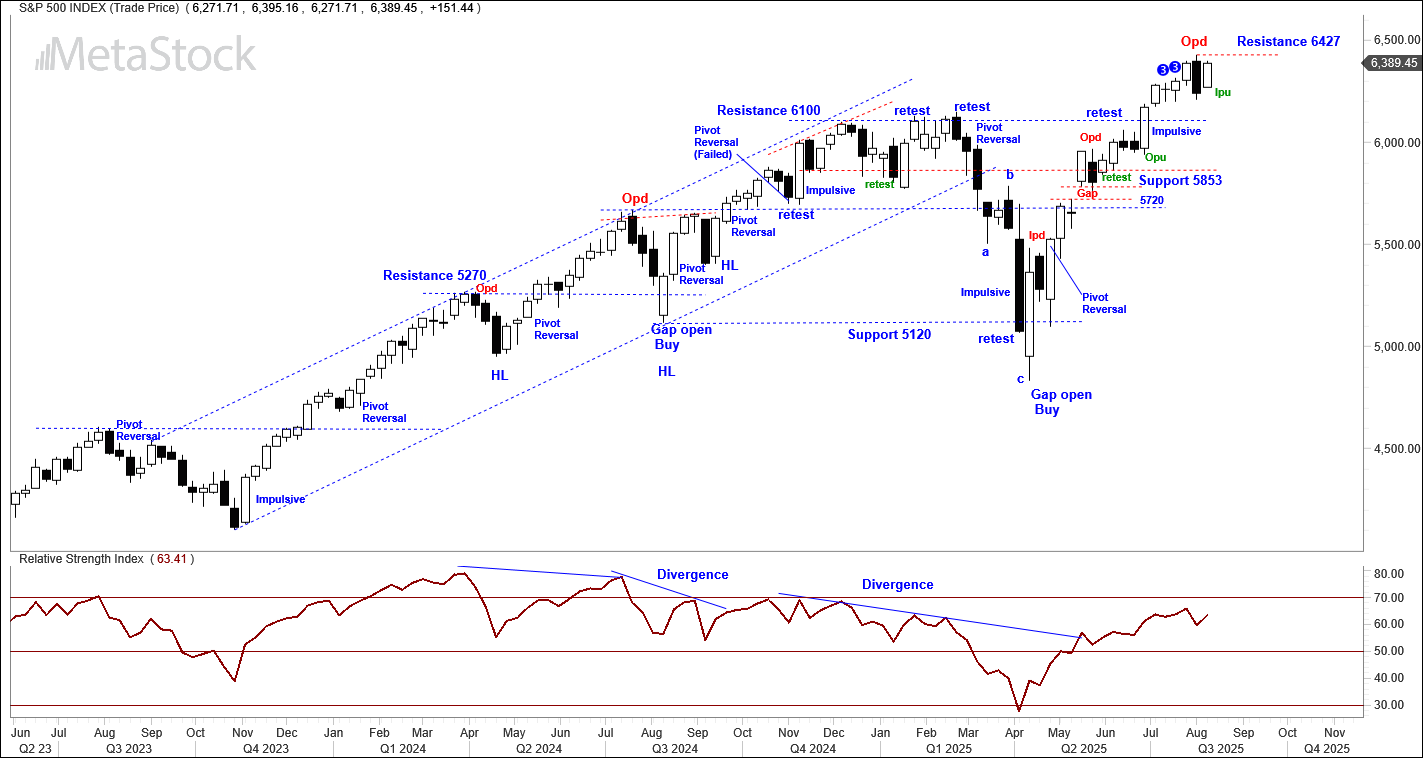
S&P 500 WEEKLY: Inside range
Key support remains at 8615 points, last week saw an inside range bar set, indicating buyer and sellers unable to take control of price direction. Without follow through lower from the outside range set two weeks ago, the market remains bullish, until the key Weekly support level of 6100 is broken to the downside. Top resistance is 6427 points a close over this level would be very Bullish in the direction of the current primary Up trend.
Indicator: Relative strength 14. Loss of momentum
As for continued bullish confirmation, a continuing movement back to higher levels of the 70 line on the RSI required. A continued directional move higher over the 70 level will indicate renewed strength and the potential for a renewed and continuing upside shift in momentum.
A reverse move back towards the 50 level would signal potential exhaustion among buyers, but without clear evidence of sellers stepping in, downside risks remain low.
Comments last week. The Pennant continuation pattern discussed last week is now better described as a consolidation range above 8615 and below the 8776 level. Last Friday set a reversal pivot point, an early developing sell signal to be confirmed with a further daily close below 8615 points. The final bar is a large range high to low; this also adds to the bearishness of the setup and the potential to retest the 8514 level during this trading week.
S&P 500 WEEKLY: Inside range
Key support remains at 8615 points, last week saw an inside range bar set, indicating buyer and sellers unable to take control of price direction. Without follow through lower from the outside range set two weeks ago, the market remains bullish, until the key Weekly support level of 6100 is broken to the downside. Top resistance is 6427 points a close over this level would be very Bullish in the direction of the current primary Up trend.
Indicator: Relative strength 14. Loss of momentum
As for continued bullish confirmation, a continuing movement back to higher levels of the 70 line on the RSI required. A continued directional move higher over the 70 level will indicate renewed strength and the potential for a renewed and continuing upside shift in momentum.
A reverse move back towards the 50 level would signal potential exhaustion among buyers, but without clear evidence of sellers stepping in, downside risks remain low.
 Comments from last week
The outside range that closes on the low of the session, Opd, has a statistically significant outcome for indicating a high point and the beginning of a continued reversal lower. This, following the emergence of the 2 X number 3 bar early warning sessions of 4 and 3 weeks ago, supports the view a top may be in place. First support is the 6100-breakout level. The underlying primary trend remains up until a defined lower high is set in this weekly time frame.
SPX DAILY
Price structure: Retest 6427
The Daily chart of the S&P 500 reveals a notable pattern of overlapping price action—where successive bars intrude upon each other’s ranges—indicating a slow, methodical grind higher rather than impulsive momentum. This type of movement often reflects a market climbing a wall of worry, with buyers cautiously advancing while sellers remain present but not dominant. It’s a classic sign of a market lacking conviction yet still leaning bullish, often seen during low-volatility uptrends or in the latter stages of a rally.
This grind appears to be targeting a retest of the 6427 level, which has emerged as a critical resistance point following its role as the high of the recent weekly Outside Bar.
A breakout higher with expanding range and volume would suggest genuine strength.
Indicator: Relative strength 14.
The Relative Strength Indicator (RSI) having moved strongly higher from the key 50 level turning in line with price action. If the RSI continues to rise from the recent point below the pivotal 50 level towards the 70 level, it will likely confirm a further Bullish outlook, leading to further UP side targets.
Comments from last week
The outside range that closes on the low of the session, Opd, has a statistically significant outcome for indicating a high point and the beginning of a continued reversal lower. This, following the emergence of the 2 X number 3 bar early warning sessions of 4 and 3 weeks ago, supports the view a top may be in place. First support is the 6100-breakout level. The underlying primary trend remains up until a defined lower high is set in this weekly time frame.
SPX DAILY
Price structure: Retest 6427
The Daily chart of the S&P 500 reveals a notable pattern of overlapping price action—where successive bars intrude upon each other’s ranges—indicating a slow, methodical grind higher rather than impulsive momentum. This type of movement often reflects a market climbing a wall of worry, with buyers cautiously advancing while sellers remain present but not dominant. It’s a classic sign of a market lacking conviction yet still leaning bullish, often seen during low-volatility uptrends or in the latter stages of a rally.
This grind appears to be targeting a retest of the 6427 level, which has emerged as a critical resistance point following its role as the high of the recent weekly Outside Bar.
A breakout higher with expanding range and volume would suggest genuine strength.
Indicator: Relative strength 14.
The Relative Strength Indicator (RSI) having moved strongly higher from the key 50 level turning in line with price action. If the RSI continues to rise from the recent point below the pivotal 50 level towards the 70 level, it will likely confirm a further Bullish outlook, leading to further UP side targets.
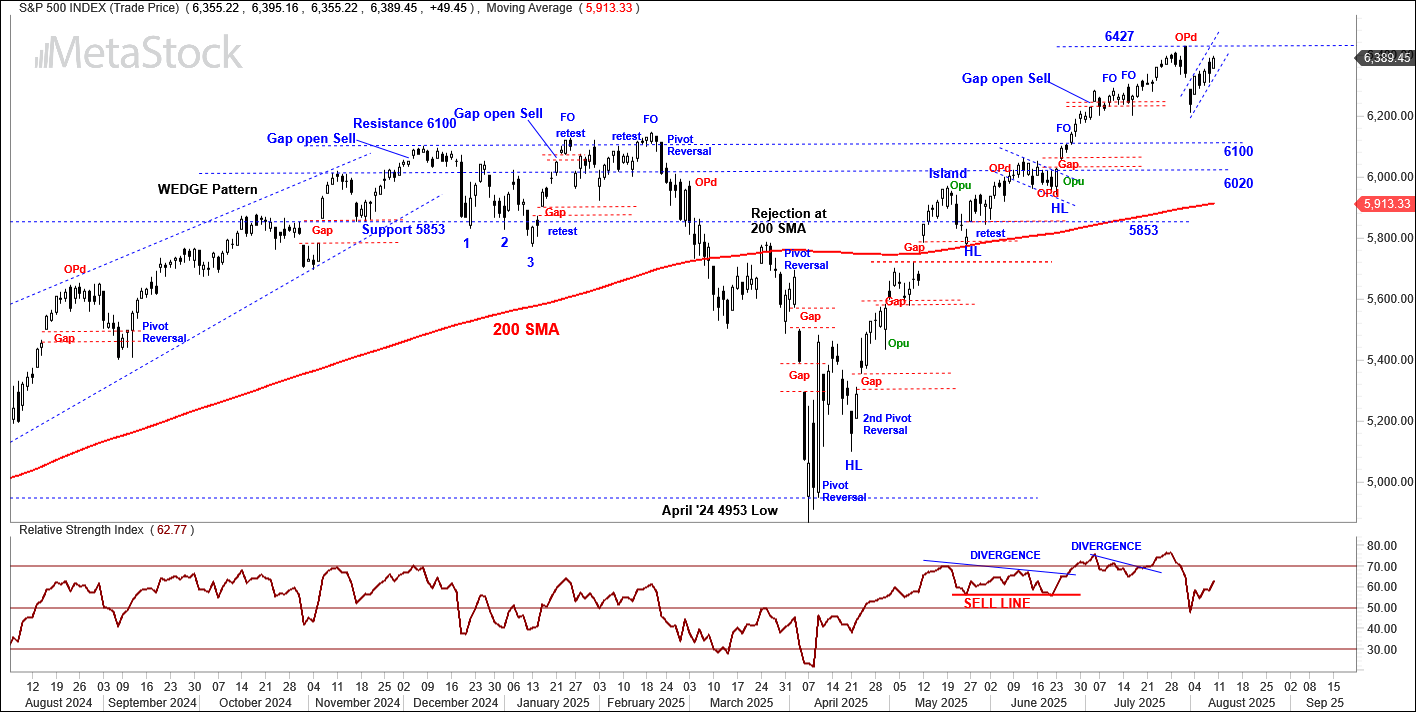 Comments from last week: The high Gap open and immediate sell down set an outside range last Thursday followed through by the Gap down on Friday. The Two large range bars indicate Buyers have lost control of price setting. The 6100-breakout level could be challenged this week, failure of the Index to hold this level may see a further retest of the 6020 Support/ Resistance level with the further potential to retest the 200 day moving average.
NASDAQ (100) DAILY Price structure: New high
The Nasdaq has surged to a new all-time high, a move set by the pivot reversal bar established last Monday. That bar marked a decisive inflection point in the index’s short-term trajectory, signalling a shift in control from Sellers to Buyers.
The reversal emerged after a brief sharp pullback into a minor support zone, where price had been compressing within a tight range. The bar itself displayed strong bullish intent
This breakout to new highs carries psychological and structural weight. Psychologically, all-time highs tend to attract momentum traders and institutional flows, as they represent uncharted territory devoid of overhead supply.
Structurally, the move confirms the validity of the pivot reversal as a launchpad, reinforcing the notion that buyers are willing to defend dips and press advantage when given the opportunity.
However, while the breakout is impressive, it’s worth noting the character of the move. If the ascent continues with expanding range and volume, it will point to a healthy high conviction move getting underway.
Indicator: Relative strength 14: Sell Signal
The Relative Strength Index (RSI) has now turned sharply higher which signals increasing Bullish momentum. With the RSI falling from the 70 level a Divergence is complete, however it would serve as a strong Bearish indicator on a further decline, this is highlighting a loss of momentum may be underway as the market makes a sharp reversal, market participants cannot afford to overlook this outcome.
Comments from last week: The high Gap open and immediate sell down set an outside range last Thursday followed through by the Gap down on Friday. The Two large range bars indicate Buyers have lost control of price setting. The 6100-breakout level could be challenged this week, failure of the Index to hold this level may see a further retest of the 6020 Support/ Resistance level with the further potential to retest the 200 day moving average.
NASDAQ (100) DAILY Price structure: New high
The Nasdaq has surged to a new all-time high, a move set by the pivot reversal bar established last Monday. That bar marked a decisive inflection point in the index’s short-term trajectory, signalling a shift in control from Sellers to Buyers.
The reversal emerged after a brief sharp pullback into a minor support zone, where price had been compressing within a tight range. The bar itself displayed strong bullish intent
This breakout to new highs carries psychological and structural weight. Psychologically, all-time highs tend to attract momentum traders and institutional flows, as they represent uncharted territory devoid of overhead supply.
Structurally, the move confirms the validity of the pivot reversal as a launchpad, reinforcing the notion that buyers are willing to defend dips and press advantage when given the opportunity.
However, while the breakout is impressive, it’s worth noting the character of the move. If the ascent continues with expanding range and volume, it will point to a healthy high conviction move getting underway.
Indicator: Relative strength 14: Sell Signal
The Relative Strength Index (RSI) has now turned sharply higher which signals increasing Bullish momentum. With the RSI falling from the 70 level a Divergence is complete, however it would serve as a strong Bearish indicator on a further decline, this is highlighting a loss of momentum may be underway as the market makes a sharp reversal, market participants cannot afford to overlook this outcome.
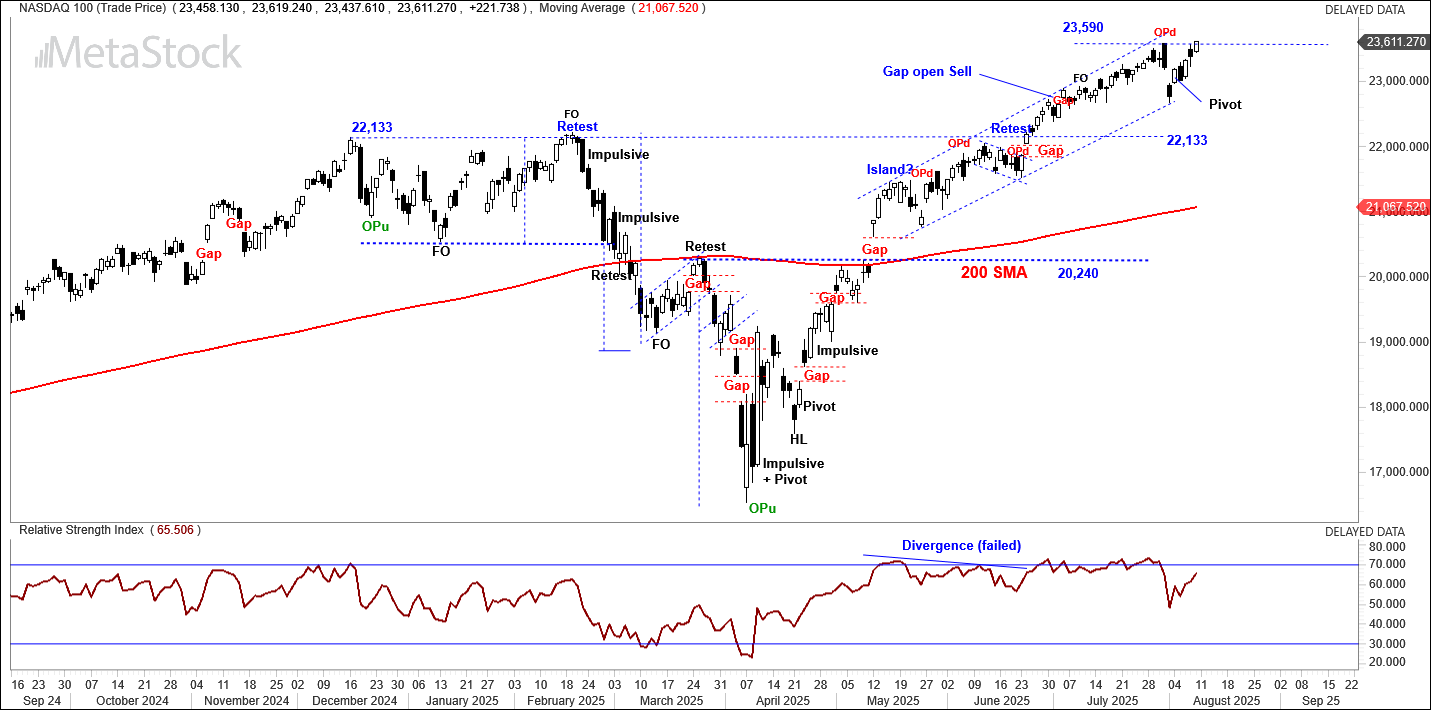 Comments from last week The Gap open last Thursday followed by the Gap down in last Friday’s trading session sets up the Index to trade lower out of the current ascending channel. First support remains at 22,133 points and further price targets into the 22,000-point open Gap area. From the emergence of this price channel in May25’ Daily price advances have been weak. The current 2 day move down has been achieved with 2 large range moves, profit taking may see the Index move lower to test the 200 day moving average.
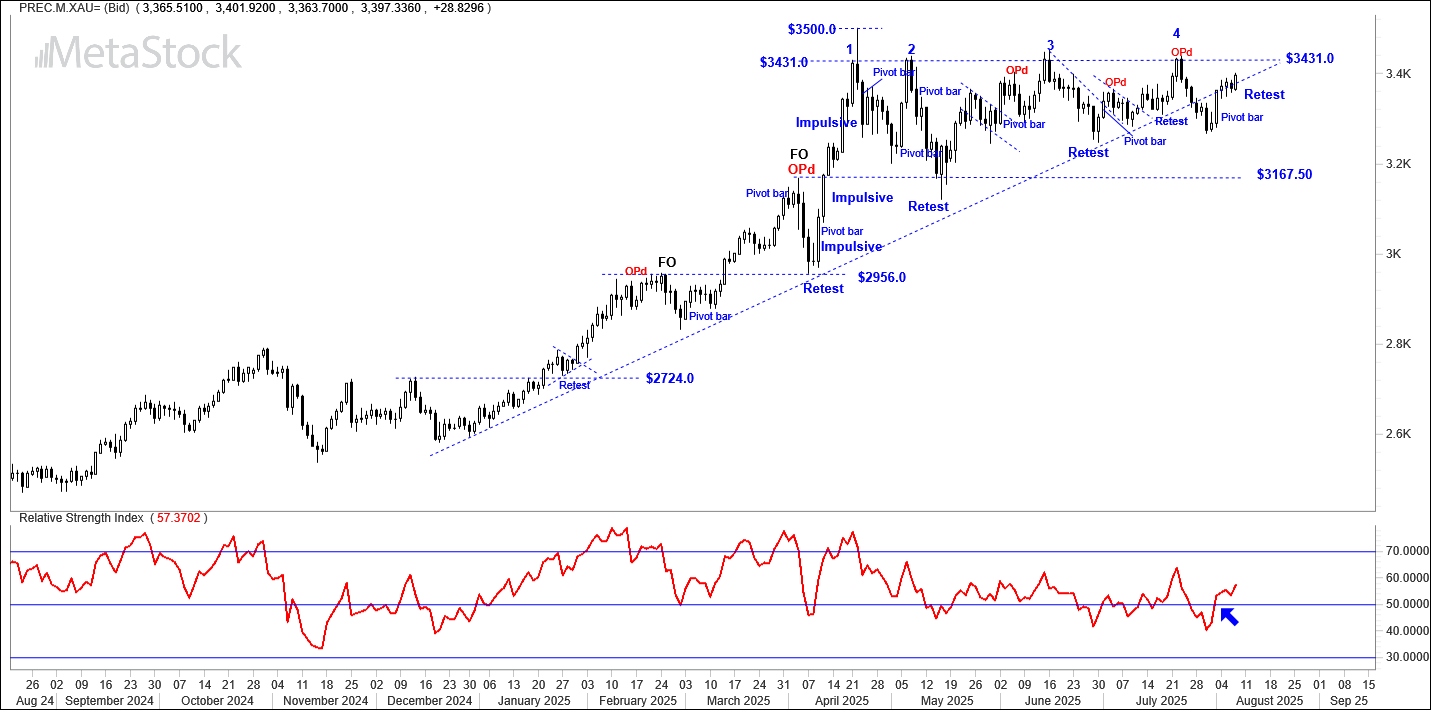
USD Spot GOLD – DAILY:
Gold continues to consolidate beneath the formidable $3431 resistance level, a price zone that has repeatedly capped upward momentum and now serves as a structural ceiling.
Recently, price broke below a well-defined ascending trendline that had been supporting the advance for several weeks. At first glance, this breakdown appeared to signal a shift in tone, perhaps the beginning of a deeper correction. However, the market’s response was swift and telling. Immediate buying pressure emerged just beneath the trendline breach, resulting in the formation of a Pivot bar, a classic reversal structure characterized by the previous lower low and a strong close over the high. This bar didn’t just halt the decline, it reasserted bullish intent and lifted price back into the prior consolidation range.
This current consolidation phase is marked by a series of compressed bars and hesitant follow-through, suggesting a market in equilibrium, neither ready to capitulate nor yet prepared to break higher.
The proximity to the $3431 resistance also keeps the option open for further distribution.
Indicator: Relative Strength 14: Bullish momentum
The RSI has reversed back higher through the 50 level, just, this is turning into a Bullish reading. Should the RSI reading further increase in the coming week towards the 70 level this will reflect an outright Buy signal. Short term holders and traders should continue to monitor the RSI for a movement remaining above the 50 level as a Buy signal.
Comments from last week The Gap open last Thursday followed by the Gap down in last Friday’s trading session sets up the Index to trade lower out of the current ascending channel. First support remains at 22,133 points and further price targets into the 22,000-point open Gap area. From the emergence of this price channel in May25’ Daily price advances have been weak. The current 2 day move down has been achieved with 2 large range moves, profit taking may see the Index move lower to test the 200 day moving average.
USD Spot GOLD – DAILY:
Gold continues to consolidate beneath the formidable $3431 resistance level, a price zone that has repeatedly capped upward momentum and now serves as a structural ceiling.
Recently, price broke below a well-defined ascending trendline that had been supporting the advance for several weeks. At first glance, this breakdown appeared to signal a shift in tone, perhaps the beginning of a deeper correction. However, the market’s response was swift and telling. Immediate buying pressure emerged just beneath the trendline breach, resulting in the formation of a Pivot bar, a classic reversal structure characterized by the previous lower low and a strong close over the high. This bar didn’t just halt the decline, it reasserted bullish intent and lifted price back into the prior consolidation range.
This current consolidation phase is marked by a series of compressed bars and hesitant follow-through, suggesting a market in equilibrium, neither ready to capitulate nor yet prepared to break higher.
The proximity to the $3431 resistance also keeps the option open for further distribution.
Indicator: Relative Strength 14: Bullish momentum
The RSI has reversed back higher through the 50 level, just, this is turning into a Bullish reading. Should the RSI reading further increase in the coming week towards the 70 level this will reflect an outright Buy signal. Short term holders and traders should continue to monitor the RSI for a movement remaining above the 50 level as a Buy signal.
 Comments from last week: The ascending pattern discussed in the past Weeks has now resolved into a simple trading range as price action moves past the key 2/3 point and trades below the ascending trendline.
Last Friday set a Bullish pivot point reversal with the potential to trade high higher in the early sessions this week. Traders should look for a retest of the $3431.0 resistance high following this current retest of the trendline.
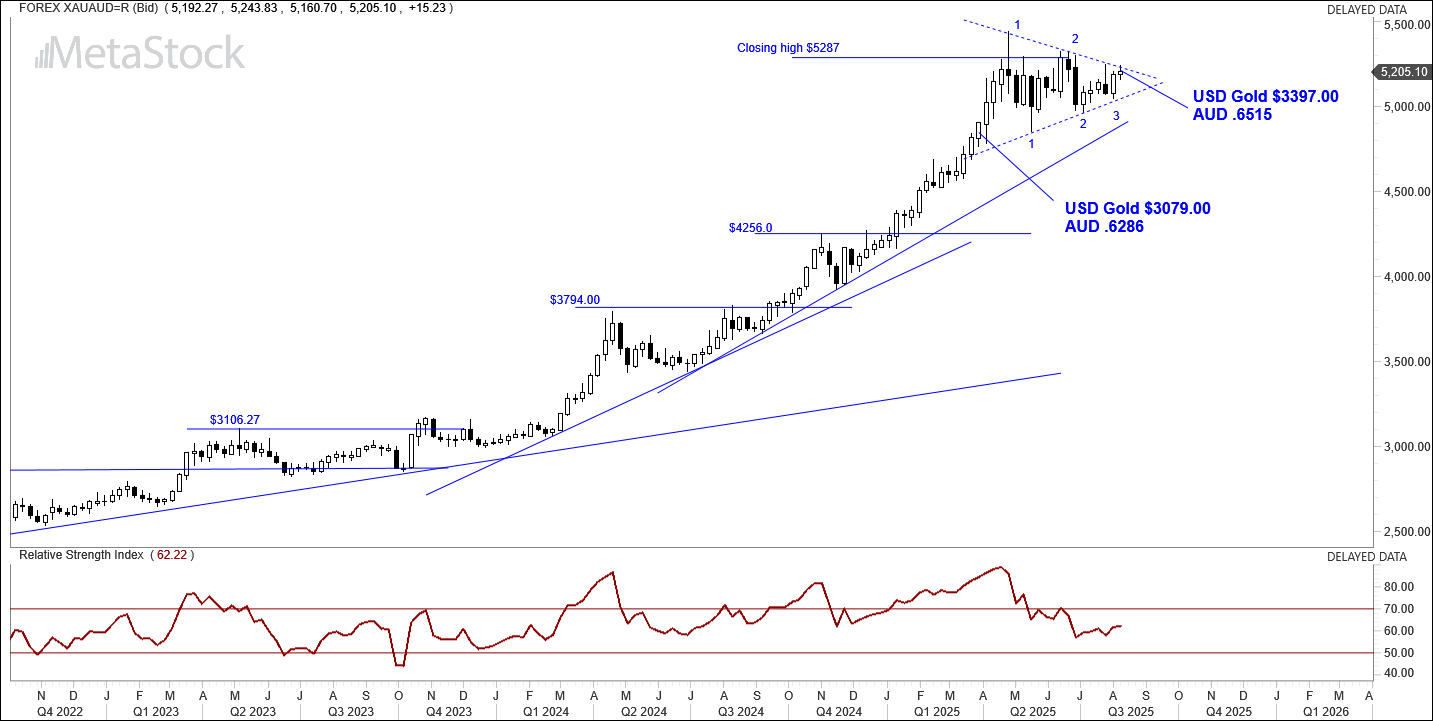
AUD GOLD – DAILY: Pennant pattern.
Consolidation continues within the developing Pennant pattern. Traders should monitor this pattern for a close over the $5287 closing high as a signal of continued support. Australian Gold producers will be favoured on continuing strength is this chart.
Indicator: Relative Strength 14: Bearish
The Relative Strength Index (RSI) is showing an upturn from the 60 level, and the reading remains above the key 50 midpoint. Momentum is slowly turning higher as the Pennant price pattern develops, a further close above the 70 level would indicate momentum has turned Bullish. Traders are advised to watch for any minor pullbacks as potential buying opportunities within this broader uptrend of Gold producers, as the overall market sentiment remains strongly in favour of continued gains.
Comments from last week: The ascending pattern discussed in the past Weeks has now resolved into a simple trading range as price action moves past the key 2/3 point and trades below the ascending trendline.
Last Friday set a Bullish pivot point reversal with the potential to trade high higher in the early sessions this week. Traders should look for a retest of the $3431.0 resistance high following this current retest of the trendline.
AUD GOLD – DAILY: Pennant pattern.
Consolidation continues within the developing Pennant pattern. Traders should monitor this pattern for a close over the $5287 closing high as a signal of continued support. Australian Gold producers will be favoured on continuing strength is this chart.
Indicator: Relative Strength 14: Bearish
The Relative Strength Index (RSI) is showing an upturn from the 60 level, and the reading remains above the key 50 midpoint. Momentum is slowly turning higher as the Pennant price pattern develops, a further close above the 70 level would indicate momentum has turned Bullish. Traders are advised to watch for any minor pullbacks as potential buying opportunities within this broader uptrend of Gold producers, as the overall market sentiment remains strongly in favour of continued gains.
 Comments from last week. Further consolidation within the developing Pennant pattern. Traders should monitor this pattern for a close over the $5287 closing high as a signal of continued support. Australian Gold producers will remain under pressure as this consolidation takes place.
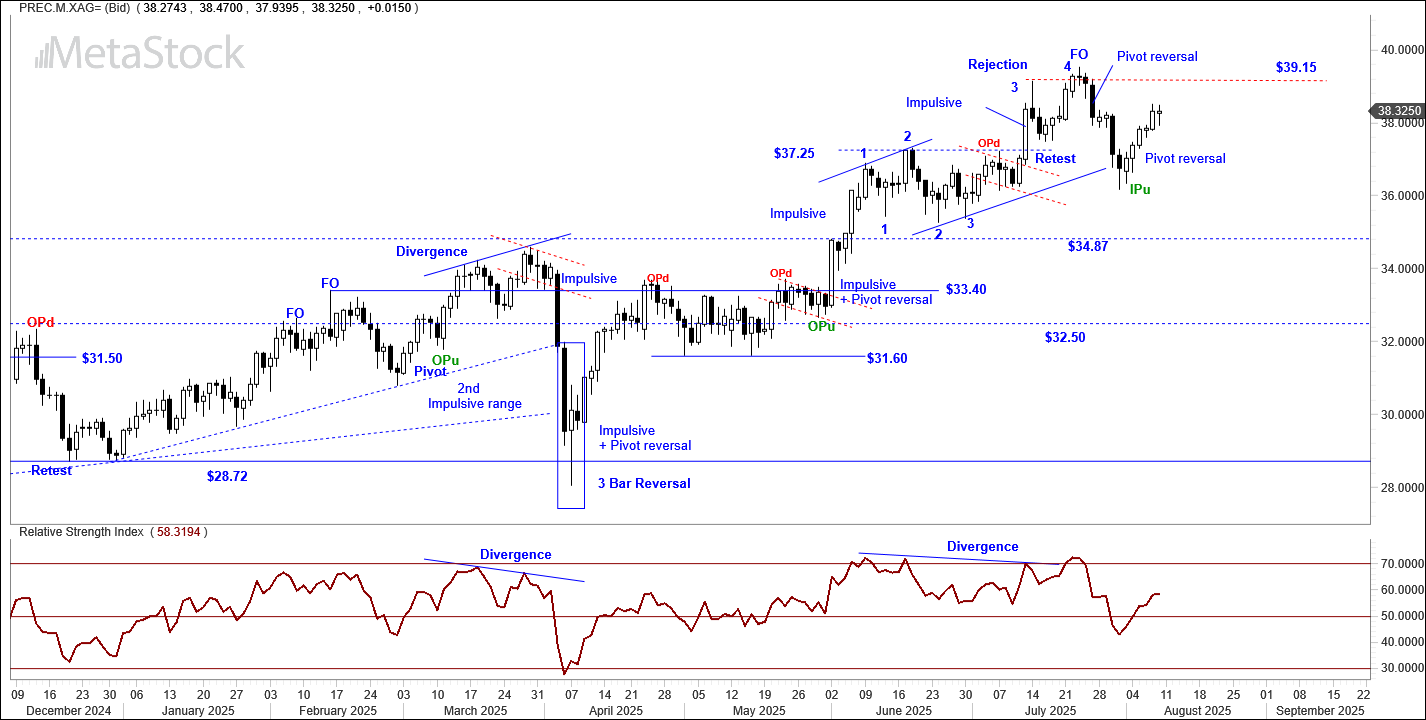
SILVER Price structure: Pivot reversal
From the observation last week, price has immediately reversed higher towards the $39.15 resistance level. This is a very positive outcome from the recent Fake out, FO, high point retracement. Silver remains within a strong Primary UP trend. Traders should look for a further close over the $39.15 level to confirm a continuation move is underway. USD Silver can develop into trading ranges.
Relative strength 14: Positive swing
The relative strength index (RSI) has moved higher to align with the Pivot reversal price rally from the $36.00 level. The current move higher has moved the RSI above the 50 level. This movement indicates a directional increase of momentum and sets a Bullish continuation signal.
Comments from last week. Further consolidation within the developing Pennant pattern. Traders should monitor this pattern for a close over the $5287 closing high as a signal of continued support. Australian Gold producers will remain under pressure as this consolidation takes place.
SILVER Price structure: Pivot reversal
From the observation last week, price has immediately reversed higher towards the $39.15 resistance level. This is a very positive outcome from the recent Fake out, FO, high point retracement. Silver remains within a strong Primary UP trend. Traders should look for a further close over the $39.15 level to confirm a continuation move is underway. USD Silver can develop into trading ranges.
Relative strength 14: Positive swing
The relative strength index (RSI) has moved higher to align with the Pivot reversal price rally from the $36.00 level. The current move higher has moved the RSI above the 50 level. This movement indicates a directional increase of momentum and sets a Bullish continuation signal.
 Comments from last week. Failure of the $37.25 breakout level to provide support in this current Daily price decline may see Silver decline further to retest the $34.87 breakout level. As the current price declines have moved below the July 24th low the current move is now considered a corrective move as sellers take control of price direction.
BITCOIN
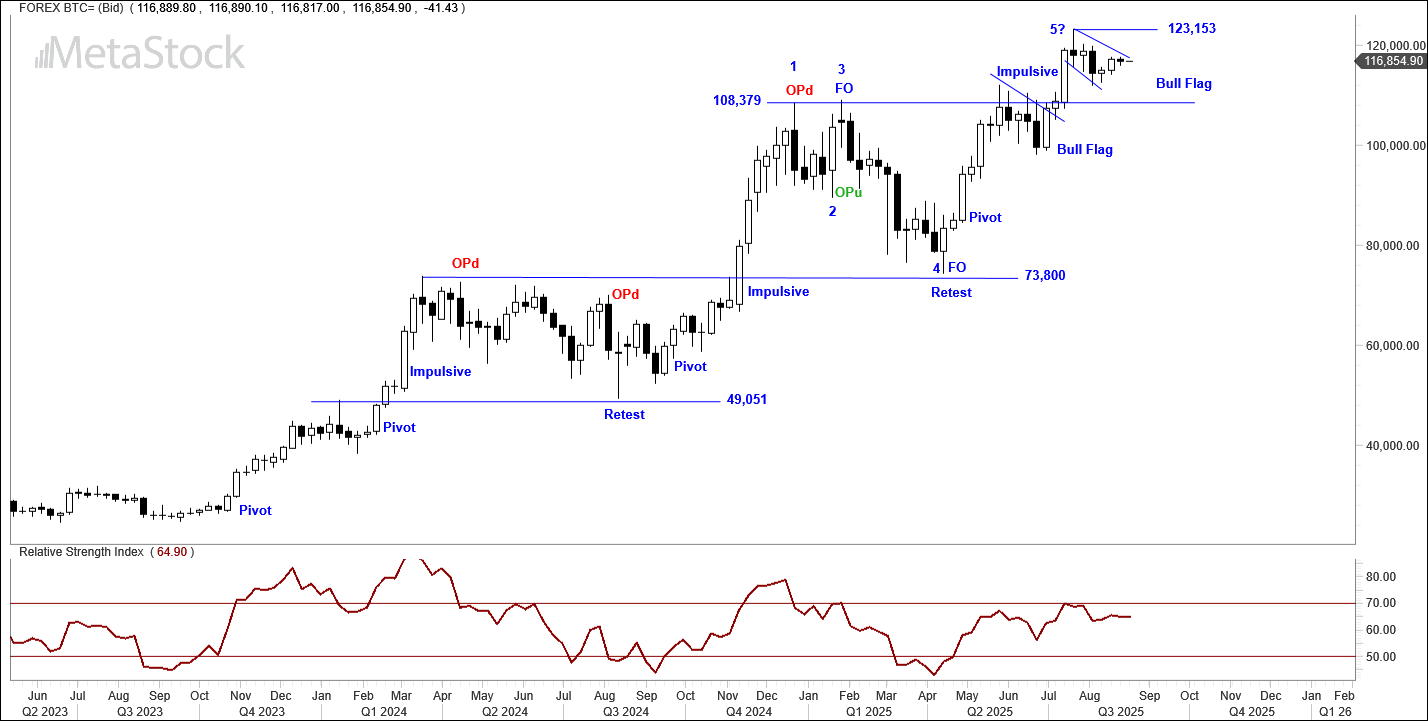
Bull Flag
The price action in Bitcoin continues to develop into a Bullish flag pattern as price grinds lower towards a retest of the $108,379 breakout level. A further close over $123,153 would signal a continuation of the underlying Primary UP trend.
A closing price below the breakout level of $108,379 would show sellers have price control, the current Bearish Wave pattern remains under watch.
Relative strength 14: Neutral
Relative Strength remains in sync with the underlying price movements. Although momentum is slowing in line with price consolidation the RSI remains above the key 50 level.
Comments from last week. Failure of the $37.25 breakout level to provide support in this current Daily price decline may see Silver decline further to retest the $34.87 breakout level. As the current price declines have moved below the July 24th low the current move is now considered a corrective move as sellers take control of price direction.
BITCOIN
Bull Flag
The price action in Bitcoin continues to develop into a Bullish flag pattern as price grinds lower towards a retest of the $108,379 breakout level. A further close over $123,153 would signal a continuation of the underlying Primary UP trend.
A closing price below the breakout level of $108,379 would show sellers have price control, the current Bearish Wave pattern remains under watch.
Relative strength 14: Neutral
Relative Strength remains in sync with the underlying price movements. Although momentum is slowing in line with price consolidation the RSI remains above the key 50 level.
 Comments from last week.
Currently Bitcoin is developing a bullish flag pattern, this will confirm as a breakout with a close over the $123,153 high however since the November 2024 impulsive breakout, Bitcoin has been forming higher highs and lower lows, a hallmark of a Bearish expanding wave pattern with the 5th wave still in development. Should price move below the $108,379 level the flag will have failed, offering sellers directional control to take price back to the $100,000 level.
Comments from last week.
Currently Bitcoin is developing a bullish flag pattern, this will confirm as a breakout with a close over the $123,153 high however since the November 2024 impulsive breakout, Bitcoin has been forming higher highs and lower lows, a hallmark of a Bearish expanding wave pattern with the 5th wave still in development. Should price move below the $108,379 level the flag will have failed, offering sellers directional control to take price back to the $100,000 level.US payrolls surprise to the downside following Fed holding ground; BoE on course for another quarter
By FP Markets
Before we dive into the key event of the week, the downside surprise in the July US payrolls data deserves note. The release offered market participants a clear-cut opportunity to trade out of, which, let’s face it, has been few and far between of late, given global uncertainty surrounding US President Donald Trump’s tariffs.
Week ahead: US CPI inflation at the forefront of the macro space
By FP Markets
In addition to ongoing US trade tariff developments, the key macroeconomic print to watch this week will be the June US CPI inflation data (Consumer Price Index). This follows the better-than-expected June US jobs report, which saw unemployment fall to 4.1% – albeit influenced by a drop in the labour force – and job growth rise to 147,000.
Week ahead: Uncertainty is the new Certainty amid the tariff deadline
By FP Markets
With US jobs data now in the rear-view mirror, the market’s focus this week shifts to US President Donald Trump’s self-imposed reciprocal tariff deadline on 9 July.
Week ahead: US Jobs data is in focus
By FP Markets
The week ahead welcomes a slew of key US employment metrics, which may further increase the odds of additional cuts from the US Federal Reserve (Fed) this year. This includes May JOLTS job openings, June ADP employment change (Automatic Data Processing), weekly jobless filings for the week ending 28 June, and, of course, the June jobs report, which will be released on Thursday due to US markets closing in observance of Independence Day.
Week ahead: US data and Powell in the spotlight
By FP Markets
‘Wait and see’ seems to be the dominant sentiment for both US President Donald Trump and the US Federal Reserve (Fed).
First Light News: Trump announces timeline on possible Iran strike; BoE dovish tilt
By FP Markets
 Good morning, everyone,
While attacks from both sides in the Israel-Iran conflict continued overnight, US President Donald Trump, like the US Federal Reserve, appears to have adopted a ‘wait-and-see’ stance for now in terms of whether the US will get involved.
According to a statement from the President, relayed by White House press secretary Karoline Leavitt: ‘Based on the fact that there is a substantial chance of negotiations that may or may not take place with Iran in the near future, I will make my decision whether or not to go within the next two weeks’.
Leavitt emphasised that any diplomatic agreement must guarantee that Iran cannot enrich uranium or develop a nuclear weapon.
A two-week window for diplomacy?
Despite earlier gains, Brent Crude prices have fallen around 2.0% today amid the two-week window offered by Trump regarding the Israel-Iran situation, essentially leaving the door open for a diplomatic resolution to avert major escalation.
Additionally, the UK and European counterparts are heading to Geneva today for talks with Iran to press for a diplomatic solution. The big question, of course, is whether this meeting will be enough to sway Trump. How these talks will change the direction of the narrative we are currently on is a tricky one to answer, I believe. However, they may provide a clearer ‘general level’ of understanding about where Iran is positioned.
Another point to consider is that the two-week window remains somewhat arbitrary; we do not have a fixed date, and let’s be frank, Trump has used the ‘two-week’ phrase on several occasions in the past. Beyond this, it remains uncertain.
BoE holds steady, but vote split takes a dovish tilt
In a more divided vote than expected, the Bank of England (BoE) maintained the bank rate at 4.25% amid geopolitical uncertainty yesterday. The decision to hold, along with the central bank’s ongoing commitment to a ‘careful and gradual’ approach, raised very few eyebrows.
Despite this, markets are pricing in an 80% probability of a 25-basis-point (bp) cut at August’s meeting. However, this is by no means certain; I feel that things can shift before then. BoE Governor Andrew Bailey commented that he ‘expects that the path of interest rates will continue to be gradually downwards’. Nevertheless, he cautioned that he was not providing a ‘prediction for August by saying that’.
Six out of the nine Monetary Policy Committee (MPC) members voted to leave the rate unchanged, while Swati Dhingra, Dave Ramsden and Alan Taylor voted to reduce the bank rate by 25 bps, to 4.00%. This was more divided than the market had expected; Refinitiv data indicated a 7-2 vote.
The move to hold rates comes despite considerable disinflation over the past two years, from a peak of 11.1% in October 2022 to 3.4% in May 2025 based on a year-on-year measure. The MPC noted that UK GDP growth (Gross Domestic Product) remains weak and the labour market continues to loosen. While pay growth is moderating and expected to slow further, inflation, as noted above, increased in May, primarily due to regulated prices and past increases in energy costs. Inflation is expected to remain at current levels for the remainder of the year, before gradually falling back towards the 2.0% target in 2026.
Despite progress, the MPC is keeping a close eye on elevated global uncertainty, particularly rising energy prices stemming from the conflict in the Middle East. The MPC stressed that monetary policy is not on a preset path and will continue to be restrictive to squeeze out persistent inflationary pressures.
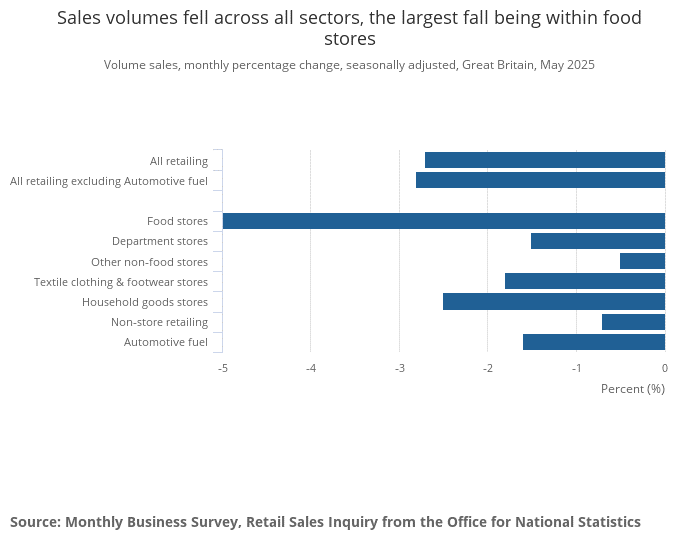
Aside from UK retail sales data, which dropped in the last hour, the upcoming docket is reasonably light in terms of tier-1 events. UK retail sales numbers experienced a considerable drop, falling 2.7% in May – marking the largest decline since late 2023 – and reversing a 1.3% gain seen in April. Food stores’ sales volume saw a notable decrease, dropping 5.0%, as shown in the table below, down from a 4.7% gain, which was its largest monthly decline since mid-2021.
Good morning, everyone,
While attacks from both sides in the Israel-Iran conflict continued overnight, US President Donald Trump, like the US Federal Reserve, appears to have adopted a ‘wait-and-see’ stance for now in terms of whether the US will get involved.
According to a statement from the President, relayed by White House press secretary Karoline Leavitt: ‘Based on the fact that there is a substantial chance of negotiations that may or may not take place with Iran in the near future, I will make my decision whether or not to go within the next two weeks’.
Leavitt emphasised that any diplomatic agreement must guarantee that Iran cannot enrich uranium or develop a nuclear weapon.
A two-week window for diplomacy?
Despite earlier gains, Brent Crude prices have fallen around 2.0% today amid the two-week window offered by Trump regarding the Israel-Iran situation, essentially leaving the door open for a diplomatic resolution to avert major escalation.
Additionally, the UK and European counterparts are heading to Geneva today for talks with Iran to press for a diplomatic solution. The big question, of course, is whether this meeting will be enough to sway Trump. How these talks will change the direction of the narrative we are currently on is a tricky one to answer, I believe. However, they may provide a clearer ‘general level’ of understanding about where Iran is positioned.
Another point to consider is that the two-week window remains somewhat arbitrary; we do not have a fixed date, and let’s be frank, Trump has used the ‘two-week’ phrase on several occasions in the past. Beyond this, it remains uncertain.
BoE holds steady, but vote split takes a dovish tilt
In a more divided vote than expected, the Bank of England (BoE) maintained the bank rate at 4.25% amid geopolitical uncertainty yesterday. The decision to hold, along with the central bank’s ongoing commitment to a ‘careful and gradual’ approach, raised very few eyebrows.
Despite this, markets are pricing in an 80% probability of a 25-basis-point (bp) cut at August’s meeting. However, this is by no means certain; I feel that things can shift before then. BoE Governor Andrew Bailey commented that he ‘expects that the path of interest rates will continue to be gradually downwards’. Nevertheless, he cautioned that he was not providing a ‘prediction for August by saying that’.
Six out of the nine Monetary Policy Committee (MPC) members voted to leave the rate unchanged, while Swati Dhingra, Dave Ramsden and Alan Taylor voted to reduce the bank rate by 25 bps, to 4.00%. This was more divided than the market had expected; Refinitiv data indicated a 7-2 vote.
The move to hold rates comes despite considerable disinflation over the past two years, from a peak of 11.1% in October 2022 to 3.4% in May 2025 based on a year-on-year measure. The MPC noted that UK GDP growth (Gross Domestic Product) remains weak and the labour market continues to loosen. While pay growth is moderating and expected to slow further, inflation, as noted above, increased in May, primarily due to regulated prices and past increases in energy costs. Inflation is expected to remain at current levels for the remainder of the year, before gradually falling back towards the 2.0% target in 2026.
Despite progress, the MPC is keeping a close eye on elevated global uncertainty, particularly rising energy prices stemming from the conflict in the Middle East. The MPC stressed that monetary policy is not on a preset path and will continue to be restrictive to squeeze out persistent inflationary pressures.
Aside from UK retail sales data, which dropped in the last hour, the upcoming docket is reasonably light in terms of tier-1 events. UK retail sales numbers experienced a considerable drop, falling 2.7% in May – marking the largest decline since late 2023 – and reversing a 1.3% gain seen in April. Food stores’ sales volume saw a notable decrease, dropping 5.0%, as shown in the table below, down from a 4.7% gain, which was its largest monthly decline since mid-2021.
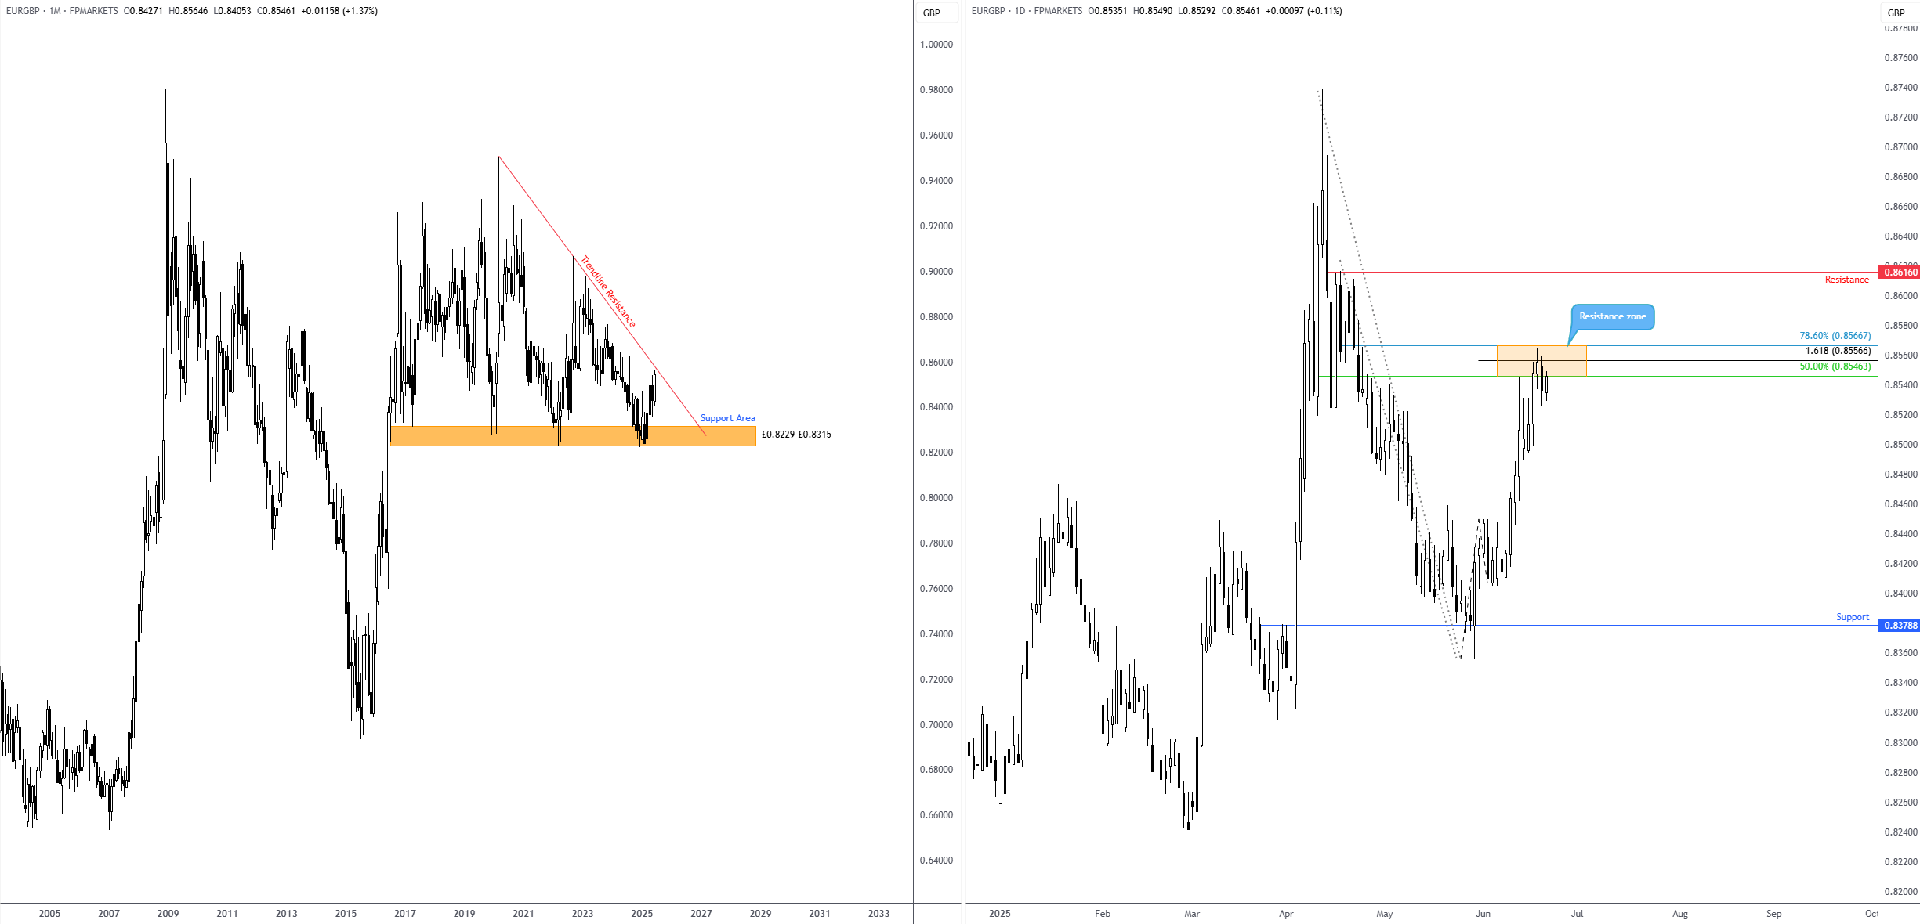
 I am still closely watching the daily resistance between £0.8567 and £0.8546 on the EUR/GBP (euro versus the British pound) for a potential breakout move higher. While bears made a show yesterday, I feel that the said resistance remains in a vulnerable position, as I briefly described yesterday:
The EUR/GBP is currently trading at daily resistance between £0.8567 and £0.8546, an area complemented by monthly trendline resistance, drawn from the high of £0.9504. The caveat here is the lack of follow-through selling beyond monthly support at £0.8229-£0.8315, which signals buyers could be gaining strength. With that said, a breakout beyond the daily resistance zone underlined above could trigger a move towards daily resistance at £0.8616.
I am still closely watching the daily resistance between £0.8567 and £0.8546 on the EUR/GBP (euro versus the British pound) for a potential breakout move higher. While bears made a show yesterday, I feel that the said resistance remains in a vulnerable position, as I briefly described yesterday:
The EUR/GBP is currently trading at daily resistance between £0.8567 and £0.8546, an area complemented by monthly trendline resistance, drawn from the high of £0.9504. The caveat here is the lack of follow-through selling beyond monthly support at £0.8229-£0.8315, which signals buyers could be gaining strength. With that said, a breakout beyond the daily resistance zone underlined above could trigger a move towards daily resistance at £0.8616.
 Charts created using Trading View
Written by FP Markets Chief Market Analyst Aaron Hill
Charts created using Trading View
Written by FP Markets Chief Market Analyst Aaron HillWeek ahead: Tariffs and US jobs data in the spotlight
By FP Markets
The beginning of the week kicked off with US President Donald Trump recommending a 50% levy on the European Union (EU), effective 1 June, claiming that the EU ‘has ‘been very difficult to deal with’. However, following a call with European Commission President Ursula von der Leyen, Trump agreed to extend the deadline to 9 July.
Week ahead: Tariffs and US Data in the spotlight
By FP Markets
It was a holiday-shortened week for many in the markets, as most financial centres closed their doors in observance of the Easter weekend. Despite this, and while everything could change with a social media post, there was a noticeable softening in the stance on trade between the US and China.
Index and Commodities Trading week beginning 14 / 04 / 2025
By FP Markets
The Index has demonstrated a solid recovery, marked by a robust candle formation that has successfully closed above the significant August 2021 high of 7,632 points. This achievement signals a noteworthy rebound from the retest low towards 7120, this could indicate renewed upward momentum in this volatile market. Breaking through this key resistance level not only highlights the strength of the recovery but also underscores the potential for continued bullish sentiment among investors.
Week Ahead: Tariffs and US Data Eyed
By FP Markets
Risk-off sentiment dominated flow last week following US President Donald Trump’s reciprocal tariff announcement, an event he described as ‘Liberation Day’. However, while I cannot speak for everyone, many are not feeling so liberated, with forecasts for growth and inflation upended, as well as economists forecasting a possible global recession.
Week Ahead: Tariff Risks and Macro Themes Ahead
By FP Markets
Another month has nearly passed, and just like that, we find ourselves in Q2 25. The week ahead promises to be eventful, with the majority of focus on US President Donald Trump’s so-called ‘Liberation Day’ on 2 April.
Week Ahead: Inflation Data on the Radar
By FP Markets
The week ahead provides plenty to get our teeth into ahead of 2 April. This is a date many will have jotted down, a day when US President Donald Trump intends to introduce broad reciprocal tariffs, which, according to him, will be a ‘liberating day for America’.
What Are Markets Watching This Week?
By FP Markets
US President Donald Trump turned up the heat on the tariff front last week, which, honestly, is becoming hard to keep track of.
The Pattern Pulse – 27 February 2025
By FP Markets
The FP Markets Research Team scans the financial markets for you, highlighting clear and actionable technical structures.
RBA Poised to Reduce Cash Rate by 25 Basis Points
By FP Markets
The Reserve Bank of Australia (RBA) will meet this Tuesday and is widely anticipated to deliver its first rate cut in four years amid easing inflationary pressures.
The Pattern Pulse – 13 February 2025
By FP Markets
The FP Markets Research Team scans the financial markets for you, highlighting clear and actionable technical structures.
Forex: EUR/USD Ready to Whipsaw Above Resistance?
The Pattern Pulse – 6 February 2025
By FP Markets
The FP Markets Research Team scans the financial markets for you, highlighting clear and actionable technical structures.
Written by FP Markets Market Analyst Aaron Hill
2025 Outlook: What is Next for Developed Economies and Currencies?
By FP Markets
What will shape the global economy and major currencies in 2025? From interest rates, inflation and jobs to US policy shifts under Trump, buckle up because it’s bound to be another exciting year ahead.
by Aaron Hill, Chief Market Analyst
BTC/USD Breaches US$100k: Where Next?
By FP Markets
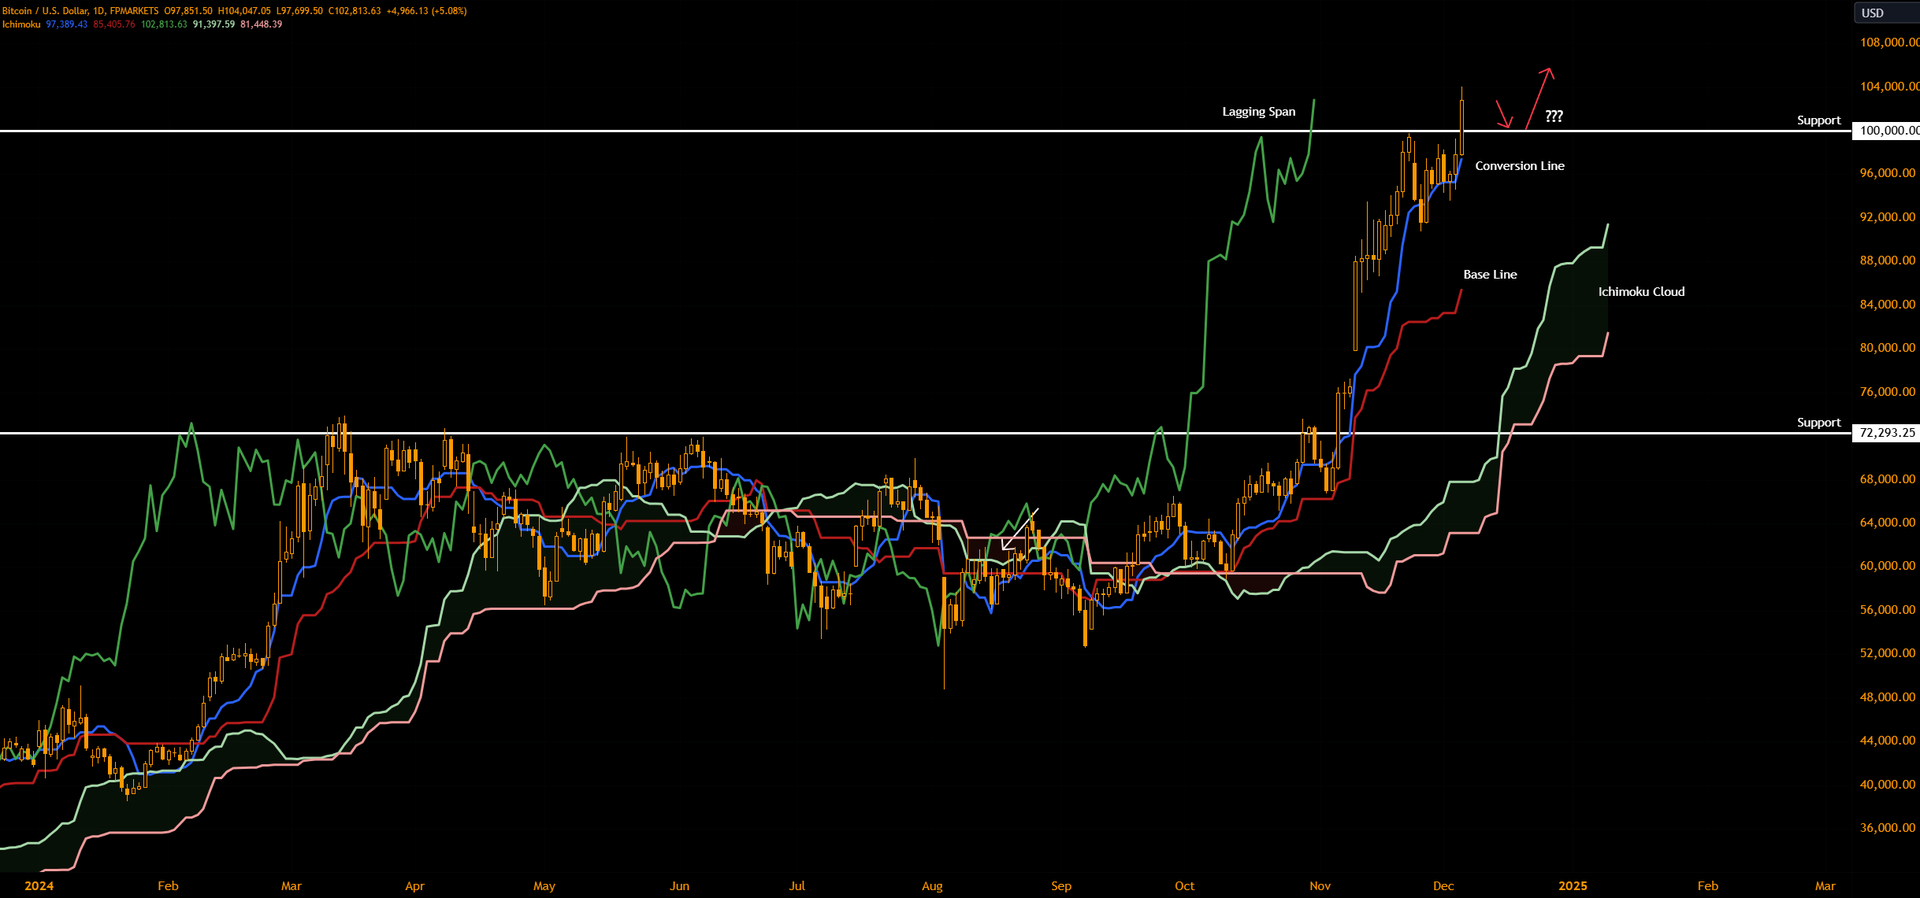
 BTC/USD (Bitcoin versus the US dollar) has made north of US$100,000 following a brief consolidation just beneath the number in the shape of a pennant pattern. Year to date, the major Crypto pair has risen by nearly 150%.
Following Donald Trump’s US election victory, BTC has strongly outperformed and, over the last 24 hours, received another boost on the back of Trump’s nomination of Paul Atkins for the role of chairing the US Securities and Exchange Commission (SEC). Atkins is an avid Crypto supporter.
Ichimoku Indicator: Bullish Signals
With price action trading beneath the Ichimoku’s Lagging Span (dark green at US$102,350), a widely recognised bullish signal, and the area between the Ichimoku’s Conversion (blue at US$97,389) and Base (red at US$85,405) Lines providing a clear support zone since late September, BTC/USD will likely remain a buyers’ market for the time being.
Also worth noting is the Ichimoku Cloud, which could offer support should the Ichimoku Conversion/Base Line support zone fail to hold. The Ichimoku Cloud is formed between the Leading Span A (light green at US$91,397) and the Leading Span B (light orange at US$81,448).
Price Direction?
Having seen BTC/USD climb above US$100,000, this level, coupled with the Ichimoku Conversion Line, could offer traders support if retested. However, it is likely that traders will position protective stop-loss orders beneath the Ichimoku Base Line to allow any retest some ‘breathing room’.
BTC/USD (Bitcoin versus the US dollar) has made north of US$100,000 following a brief consolidation just beneath the number in the shape of a pennant pattern. Year to date, the major Crypto pair has risen by nearly 150%.
Following Donald Trump’s US election victory, BTC has strongly outperformed and, over the last 24 hours, received another boost on the back of Trump’s nomination of Paul Atkins for the role of chairing the US Securities and Exchange Commission (SEC). Atkins is an avid Crypto supporter.
Ichimoku Indicator: Bullish Signals
With price action trading beneath the Ichimoku’s Lagging Span (dark green at US$102,350), a widely recognised bullish signal, and the area between the Ichimoku’s Conversion (blue at US$97,389) and Base (red at US$85,405) Lines providing a clear support zone since late September, BTC/USD will likely remain a buyers’ market for the time being.
Also worth noting is the Ichimoku Cloud, which could offer support should the Ichimoku Conversion/Base Line support zone fail to hold. The Ichimoku Cloud is formed between the Leading Span A (light green at US$91,397) and the Leading Span B (light orange at US$81,448).
Price Direction?
Having seen BTC/USD climb above US$100,000, this level, coupled with the Ichimoku Conversion Line, could offer traders support if retested. However, it is likely that traders will position protective stop-loss orders beneath the Ichimoku Base Line to allow any retest some ‘breathing room’.
When Do US Elections Polls Close?
By FP Markets
Hundreds of millions of Americans head to the ballots today to vote for who they believe should be their next President: Kamala Harris or Donald Trump. Although more than 81 million ballots have been cast early this year, most of the electorate will do so today, ultimately determining who will reside in the White House and control the Senate.
The Pattern Pulse – 24 October 2024
By FP Markets
Your weekly outlook of technical patterns and structure.
The FP Markets Research Team scans the financial markets for you, highlighting clear and actionable technical structures.
USD/CAD Powering Higher Ahead of Canadian CPI Numbers
By FP Markets
Month to date, the USD/CAD currency pair (US dollar versus the Canadian dollar) is up 2.0% and testing monthly highs.
EUR/GBP Eyeing Year-To-Date Lows
By FP Markets
The euro (EUR) versus the British pound (GBP) has been entrenched in a steady downtrend since late 2022, using the 200-day simple moving average (SMA) as dynamic resistance on several occasions.
EUR/JPY Closing in on 200-Day SMA
By FP Markets
Versus the Japanese yen (JPY), the US dollar (USD) is exploring terrain within the Ichimoku Cloud (formed by the Leading Span A at ¥160.10 [green] and the Leading Span B [orange] at ¥161.18). As you can see, sellers have recently displayed interest in the area despite not establishing much presence.
What is Happening with BTC/USD?
By FP Markets
 BTC/USD Up 50% This Year
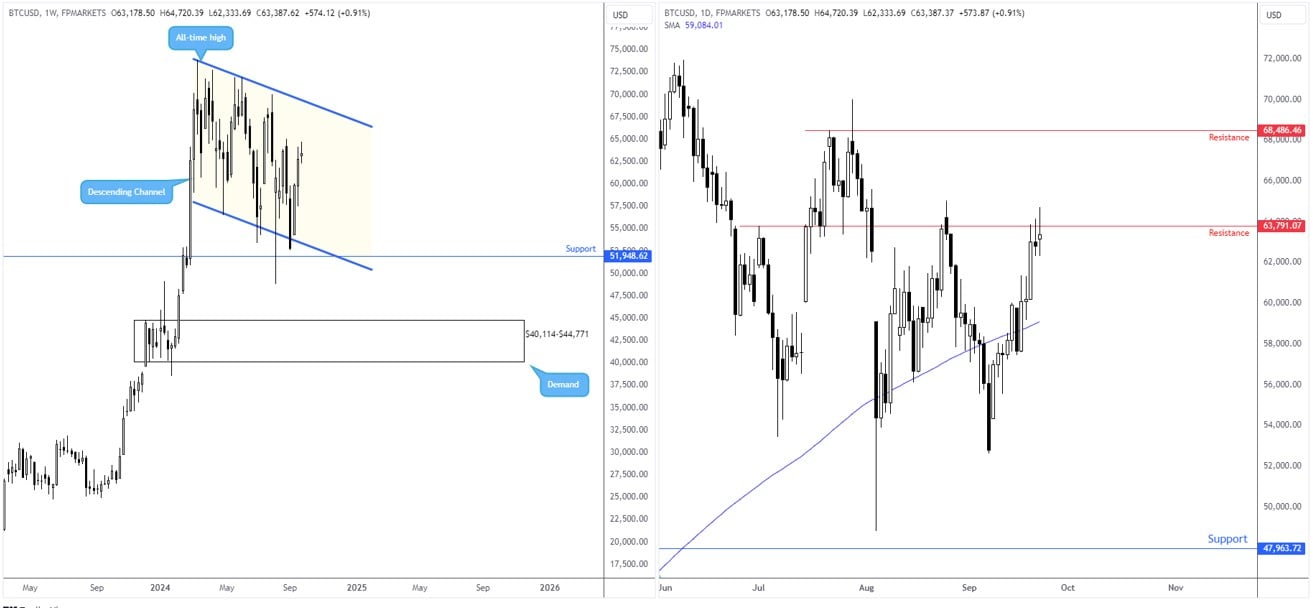
Bitcoin versus the US dollar (BTC/USD) has unquestionably been an outperformer. BTC/USD is up more than 50% year to date, and nearly 10% this month. However, we have to consider that the majority of the outperformance materialised in the first quarter of this year when the major crypto pairing hit an all-time high of US$73,845. Since then, buyers and sellers have been squaring off amid two descending limits between the said record peak and a low of US$56,478, commonly referred to as a descending channel among technical analysts.
The question is whether the descending channel is simply the pairing consolidating before printing another leg higher, or is it a sign of weakness that could eventually see the unit explore lower price levels.
Breakout Above Resistance?
Looking at the daily timeframe for a more magnified view, price action is seen testing resistance at US$63,791 and although sellers have made an appearance from the level, buyers remain strong. This follows a break above (and retest of) the 200-day simple moving average, currently circling around the US$59,085 region, which in itself is a bullish trend reversal signal.
Given the room to navigate higher on the weekly chart towards the upper boundary of the channel, a breakout above daily resistance should not raise too many eyebrows. Conservative traders attempting to trade any breakout higher will unlikely commit without a filter, such as a retest of the breached resistance to form support or even a ‘time’ filter (for example, the number of days price spends above the level).
BTC/USD Up 50% This Year
Bitcoin versus the US dollar (BTC/USD) has unquestionably been an outperformer. BTC/USD is up more than 50% year to date, and nearly 10% this month. However, we have to consider that the majority of the outperformance materialised in the first quarter of this year when the major crypto pairing hit an all-time high of US$73,845. Since then, buyers and sellers have been squaring off amid two descending limits between the said record peak and a low of US$56,478, commonly referred to as a descending channel among technical analysts.
The question is whether the descending channel is simply the pairing consolidating before printing another leg higher, or is it a sign of weakness that could eventually see the unit explore lower price levels.
Breakout Above Resistance?
Looking at the daily timeframe for a more magnified view, price action is seen testing resistance at US$63,791 and although sellers have made an appearance from the level, buyers remain strong. This follows a break above (and retest of) the 200-day simple moving average, currently circling around the US$59,085 region, which in itself is a bullish trend reversal signal.
Given the room to navigate higher on the weekly chart towards the upper boundary of the channel, a breakout above daily resistance should not raise too many eyebrows. Conservative traders attempting to trade any breakout higher will unlikely commit without a filter, such as a retest of the breached resistance to form support or even a ‘time’ filter (for example, the number of days price spends above the level).
GBP/USD Eyeing Lower Levels?
By FP Markets
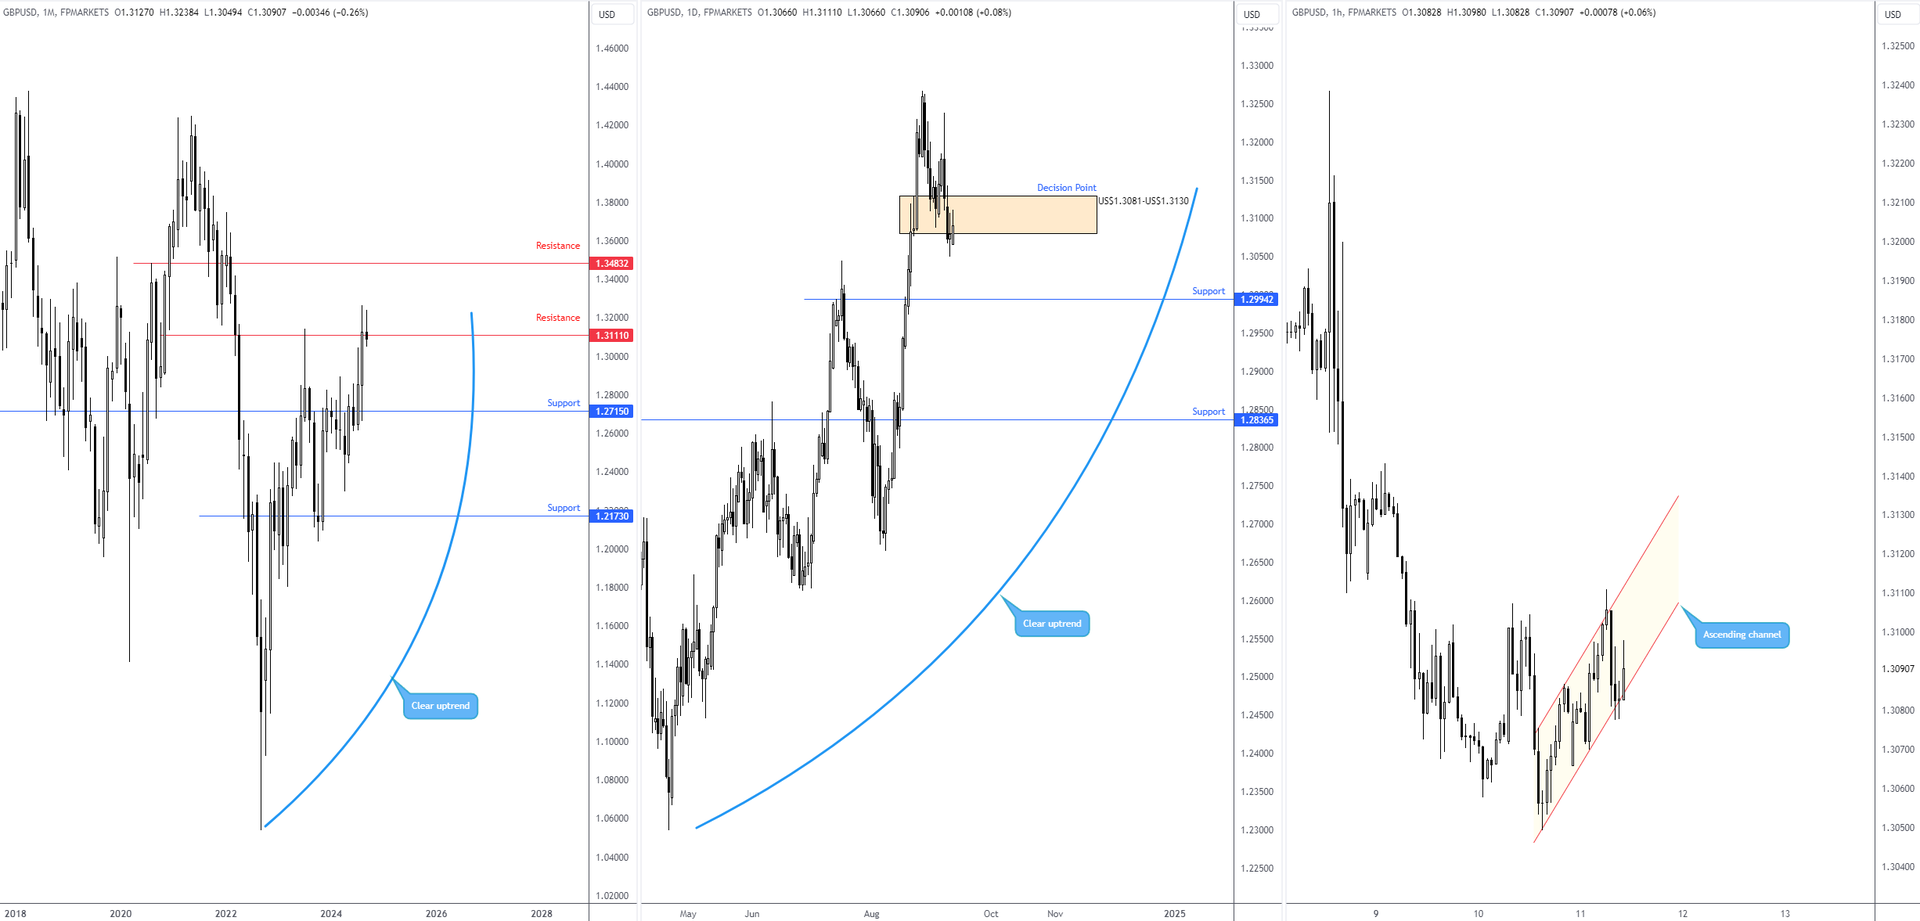
 Following economic activity in July stagnating for a second consecutive month, the focus was on the GBP/USD currency pair (British pound versus the US dollar).
Monthly Resistance
Technically, the trend remains to the upside for the pairing and recently reached a year-to-date high of US$1.3267.
Longer-term price action on the monthly timeframe is struggling to find acceptance above resistance at US$1.3111. Although recently breaching this resistance and spiking above the high of US$1.3142 (July 2023) helps confirm an uptrend, the fact price is struggling at the aforementioned resistance may concern prospective buyers.
Daily Decision Point Zone Breached
Knowing that monthly price is attempting to hold things below resistance, price action on the daily timeframe is seen navigating below a decision point zone at US$1.3081-US$1.3130. Should price clear willing bids around this area, further underperformance could be seen as far south as support coming in at US$1.2994.
H1 Ascending Channel In View
What’s interesting from a technical perspective is that H1 price is also currently working within the limits of an ascending channel between US$1.3049 and US$1.3087. Ultimately, should H1 action breakout below the said channel, coupled with what the monthly and daily timeframes are currently showing, this could trigger bearish interest towards the US$1.30 handle, closely shadowed by daily support from US$1.2994.
Following economic activity in July stagnating for a second consecutive month, the focus was on the GBP/USD currency pair (British pound versus the US dollar).
Monthly Resistance
Technically, the trend remains to the upside for the pairing and recently reached a year-to-date high of US$1.3267.
Longer-term price action on the monthly timeframe is struggling to find acceptance above resistance at US$1.3111. Although recently breaching this resistance and spiking above the high of US$1.3142 (July 2023) helps confirm an uptrend, the fact price is struggling at the aforementioned resistance may concern prospective buyers.
Daily Decision Point Zone Breached
Knowing that monthly price is attempting to hold things below resistance, price action on the daily timeframe is seen navigating below a decision point zone at US$1.3081-US$1.3130. Should price clear willing bids around this area, further underperformance could be seen as far south as support coming in at US$1.2994.
H1 Ascending Channel In View
What’s interesting from a technical perspective is that H1 price is also currently working within the limits of an ascending channel between US$1.3049 and US$1.3087. Ultimately, should H1 action breakout below the said channel, coupled with what the monthly and daily timeframes are currently showing, this could trigger bearish interest towards the US$1.30 handle, closely shadowed by daily support from US$1.2994.
Week Ahead: What Are Markets Watching This Week?
By FP Markets
Dominant asset drivers to be aware of this week include Global PMIs and the Bank of Canada’s (BoC) rate announcement on Wednesday, the advance estimate for US GDP growth on Thursday and the US PCE Price Index on Friday.
The Pattern Pulse – 9 May 2024
By FP Markets
Your weekly outlook of technical patterns and structure.
The FP Markets Research Team scans the financial markets for you, highlighting clear and actionable technical structures.
The Pattern Pulse – 2 May 2024
By FP Markets
Your weekly outlook of technical patterns and structure.
The FP Markets Research Team scans the financial markets for you, highlighting clear and actionable technical structures.
The Pattern Pulse – 25 April 2024
By FP Markets
Your weekly outlook of technical patterns and structure.
The FP Markets Research Team scans the financial markets for you, highlighting clear and actionable technical structures.
Forex: GBP/USD Recoils from Noted Support, Targetting Resistance
GBP/USD Crossing Swords with Technical Confluence!
By FP Markets
Amidst a dovish repricing, according to the OIS curve, sterling is on the back foot against the majority of its G10 peers ahead of the US cash open, currently down -0.4% versus its US counterpart.
The Pattern Pulse—4 April 2024
By FP Markets
Your weekly outlook of technical patterns and structure.
The FP Markets Research Team scans the financial markets for you, highlighting clear and actionable technical structures.
The terms and conditions of use set out below (referred to as "FX Blue's Terms"), form a contractual agreement governing FX Blue's relationship with you in relation to your use of this Website (“Agreement”) and you agree to be legally bound by FX Blue's Terms just as if you had signed this Agreement. By using this Website and any Information, you are agreeing to comply with and be bound by FX Blue's Terms, including any revisions that may be made to FX Blue's Terms from time to time. FX Blue reserves the right, in FX Blue's sole discretion, to change, modify, add or remove portions of FX Blue's Terms at any time by posting the revisions on the Website. You should check FX Blue's Terms periodically for changes as by using the Website after FX Blue posts any changes to FX Blue's Terms, you are agreeing to accept those changes, whether or not you have reviewed them, and you waive any right you may have to receive individualised notice of such changes. FX Blue's Terms may be supplemented by additional terms and conditions pertaining to specific content and activities. You agree and understand that such additional terms and conditions are hereby incorporated by reference to FX Blue's Terms. Your continued use of the Website means that you accept any new or modified FX Blue Terms.