What Are Markets Watching This Week?
 US President Donald Trump turned up the heat on the tariff front last week, which, honestly, is becoming hard to keep track of. While it may be different not long after I publish this, as of writing, tomorrow will see the US administration impose 25% tariffs on Canada and Mexico following the 30-day reprieve. A 10% levy on goods imported from China will also be imposed – in addition to the 10% tariff levied in early February – which Beijing has warned it would counter with retaliatory measures.
Last week, the European Union (EU) was also firmly in the firing line. At a cabinet meeting, Trump threatened to enforce 25% tariffs on the EU, stating that a ‘decision has been made and would be announced very soon’. As expected, the EU swiftly countered, noting that it was ready to respond ‘firmly and immediately’.
I think tariffs will be imposed tomorrow, but whether they will be enforced at the planned rates is another story entirely. Time will tell. Should Trump pull the trigger at the intended rates, this will likely benefit the US dollar (USD) and weigh on US equities.
US Jobs Data in Focus
On the macro side, a busy slate of economic data in the US awaits this week, with the majority of eyes on Friday’s US employment situation report for February. Economists’ expectations suggest that the economy added 153,000 new payrolls, a touch higher than January’s reading of 143,000. Importantly, we do have a broad estimate range to work with between 300,000 and 100,000. The unemployment rate is expected to remain unchanged at 4.0% (estimate range between 4.1% and 3.9%), with month-on-month (MM) wage growth anticipated to ease to 0.3% (from 0.5%) and remain unchanged at 4.1% on a year-on-year basis (YY).
Efforts from Elon Musk’s Department of Government Efficiency (DOGE) to reduce US federal jobs are unlikely to show much in current data. Also, note that the Bureau of Labor’s (BLS) reference week for the February payroll report typically includes the 12th day of the month. This is the week the BLS begins gathering data on employment status, and it is about when federal job cuts were getting going.
Ahead of Friday’s print, some of the focus will be on the ISM surveys (Institute for Supply Management) for manufacturing and services PMIs (Purchasing Managers’ Indexes) scheduled to be released today and Wednesday, respectively. Investors will be watching these surveys for signs of economic strength. Generally, business employment surveys have been softer of late. The S&P Global US PMIs revealed a disentangling in the service sector, now below 49.7 (February) and into contractionary territory. This clearly concerned market participants and underscored US growth concerns, given this is the first contractionary signal from the services index since around early 2023. Overall, the new government’s approach appears to be starting to influence business sentiment.
Upside pressure on weekly unemployment claims (for the week ending 22 February) in the recent print also makes Thursday’s release essential to watch for the week ending 1 March. The higher-than-expected surge in jobless claims saw data rise to levels not seen since late 2024. At this point, I did not see any indications that the mass dismissals of federal government employees inflated claims.
On the whole, the Citi US Economic Surprise Index has been in a downtrend since November 2024, and consumer confidence took a hit in February, highlighting (and fuelling) US growth worries. US economic activity continues to run at an annualised pace of 2.3% for Q4 24 (per the second estimate) – you may have also already seen the Federal Reserve Bank of Atlanta GDPNow tracker indicates US growth is on pace to contract by 1.5% in Q1 25. However, the primary driver behind the drop is net exports; therefore, on top of this measure’s quarter-on-quarter volatility, we will likely see a moderate rebound here as more data becomes available.
From a technical standpoint, I published where I currently am on the US Dollar Index here. If upcoming US data further highlights growth concerns – softer ISM data and lower job growth – this could cause US Treasury yields, equities, and commodities to depreciate. However, at this juncture, should the above data indicate additional weakness, strength in the USD could be seen (in my opinion, we are on the left side of the ‘Dollar Smile’) as safe-haven demand may take over.
Weekly G10 FX Performance
US President Donald Trump turned up the heat on the tariff front last week, which, honestly, is becoming hard to keep track of. While it may be different not long after I publish this, as of writing, tomorrow will see the US administration impose 25% tariffs on Canada and Mexico following the 30-day reprieve. A 10% levy on goods imported from China will also be imposed – in addition to the 10% tariff levied in early February – which Beijing has warned it would counter with retaliatory measures.
Last week, the European Union (EU) was also firmly in the firing line. At a cabinet meeting, Trump threatened to enforce 25% tariffs on the EU, stating that a ‘decision has been made and would be announced very soon’. As expected, the EU swiftly countered, noting that it was ready to respond ‘firmly and immediately’.
I think tariffs will be imposed tomorrow, but whether they will be enforced at the planned rates is another story entirely. Time will tell. Should Trump pull the trigger at the intended rates, this will likely benefit the US dollar (USD) and weigh on US equities.
US Jobs Data in Focus
On the macro side, a busy slate of economic data in the US awaits this week, with the majority of eyes on Friday’s US employment situation report for February. Economists’ expectations suggest that the economy added 153,000 new payrolls, a touch higher than January’s reading of 143,000. Importantly, we do have a broad estimate range to work with between 300,000 and 100,000. The unemployment rate is expected to remain unchanged at 4.0% (estimate range between 4.1% and 3.9%), with month-on-month (MM) wage growth anticipated to ease to 0.3% (from 0.5%) and remain unchanged at 4.1% on a year-on-year basis (YY).
Efforts from Elon Musk’s Department of Government Efficiency (DOGE) to reduce US federal jobs are unlikely to show much in current data. Also, note that the Bureau of Labor’s (BLS) reference week for the February payroll report typically includes the 12th day of the month. This is the week the BLS begins gathering data on employment status, and it is about when federal job cuts were getting going.
Ahead of Friday’s print, some of the focus will be on the ISM surveys (Institute for Supply Management) for manufacturing and services PMIs (Purchasing Managers’ Indexes) scheduled to be released today and Wednesday, respectively. Investors will be watching these surveys for signs of economic strength. Generally, business employment surveys have been softer of late. The S&P Global US PMIs revealed a disentangling in the service sector, now below 49.7 (February) and into contractionary territory. This clearly concerned market participants and underscored US growth concerns, given this is the first contractionary signal from the services index since around early 2023. Overall, the new government’s approach appears to be starting to influence business sentiment.
Upside pressure on weekly unemployment claims (for the week ending 22 February) in the recent print also makes Thursday’s release essential to watch for the week ending 1 March. The higher-than-expected surge in jobless claims saw data rise to levels not seen since late 2024. At this point, I did not see any indications that the mass dismissals of federal government employees inflated claims.
On the whole, the Citi US Economic Surprise Index has been in a downtrend since November 2024, and consumer confidence took a hit in February, highlighting (and fuelling) US growth worries. US economic activity continues to run at an annualised pace of 2.3% for Q4 24 (per the second estimate) – you may have also already seen the Federal Reserve Bank of Atlanta GDPNow tracker indicates US growth is on pace to contract by 1.5% in Q1 25. However, the primary driver behind the drop is net exports; therefore, on top of this measure’s quarter-on-quarter volatility, we will likely see a moderate rebound here as more data becomes available.
From a technical standpoint, I published where I currently am on the US Dollar Index here. If upcoming US data further highlights growth concerns – softer ISM data and lower job growth – this could cause US Treasury yields, equities, and commodities to depreciate. However, at this juncture, should the above data indicate additional weakness, strength in the USD could be seen (in my opinion, we are on the left side of the ‘Dollar Smile’) as safe-haven demand may take over.
Weekly G10 FX Performance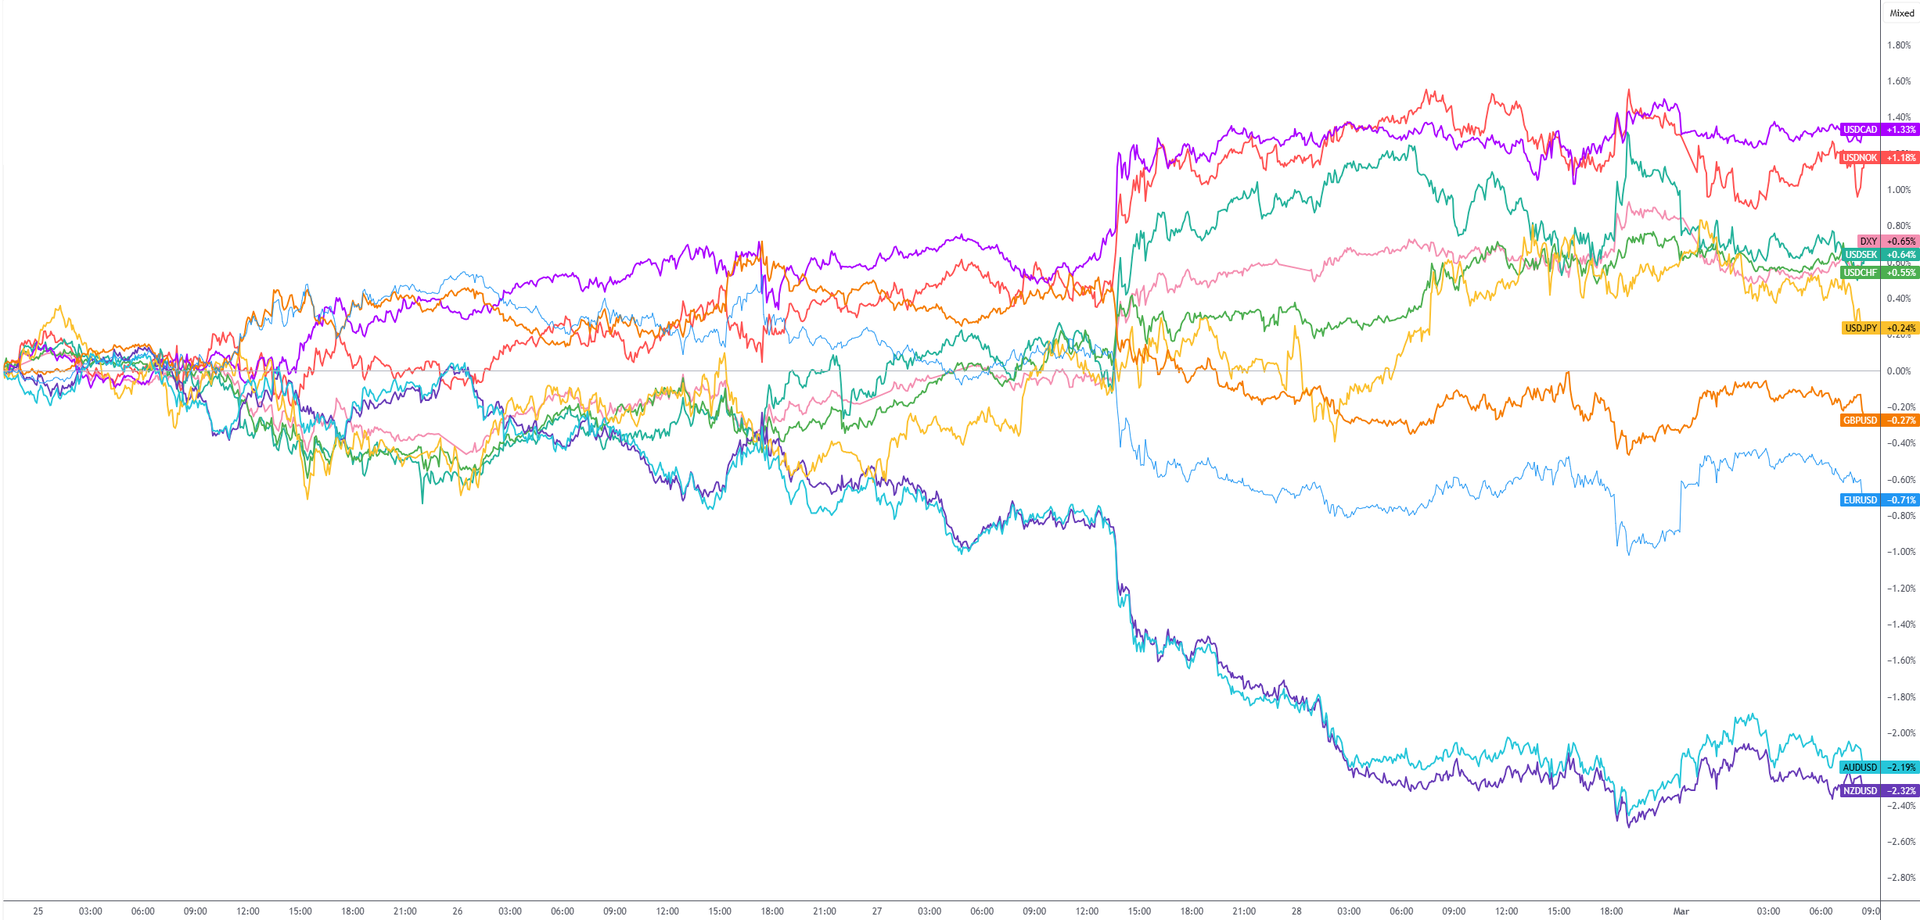 Chart created using TradingView
Written by FP Markets Market Analyst Aaron Hill
Chart created using TradingView
Written by FP Markets Market Analyst Aaron HillPublication date:
2025-03-03 11:16:16 (GMT)