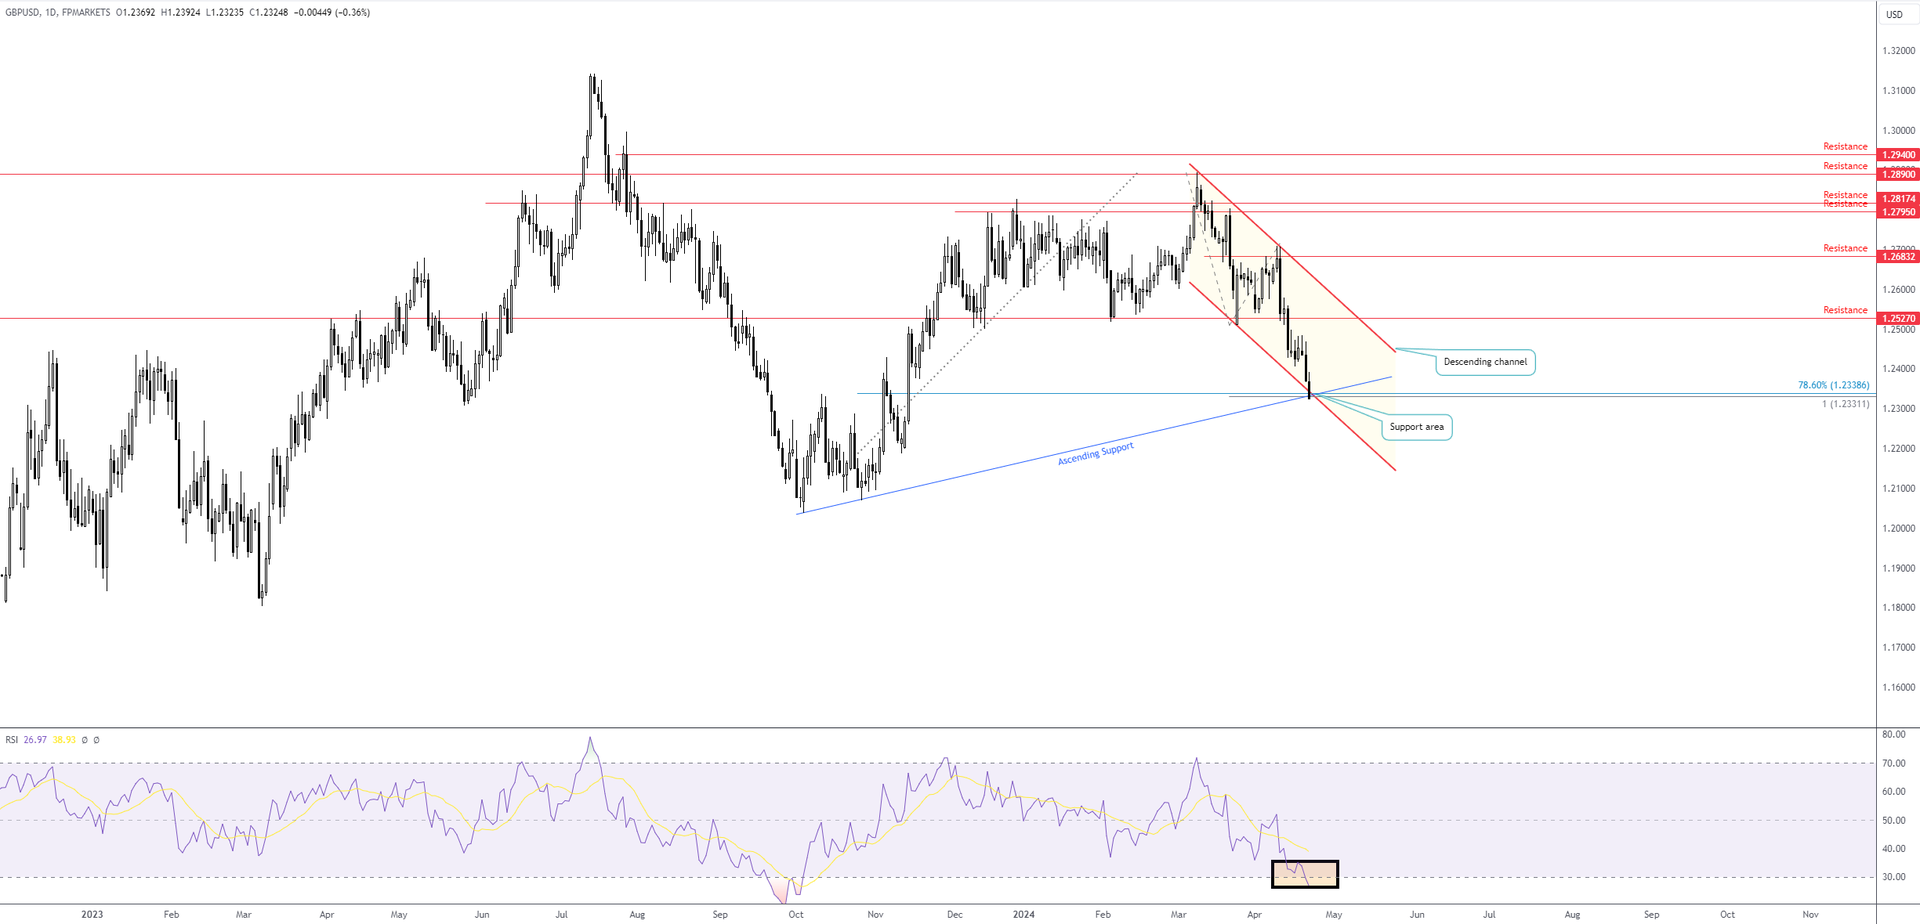
GBP/USD Crossing Swords with Technical Confluence!
Disclaimer:
DISCLAIMER:
The information contained in this material is intended for general advice only. It does not take into account your investment objectives, financial situation or particular needs. FP Markets has made every effort to ensure the accuracy of the information as at the date of publication. FP Markets does not give any warranty or representation as to the material. Examples included in this material are for illustrative purposes only. To the extent permitted by law, FP Markets and its employees shall not be liable for any loss or damage arising in any way (including by way of negligence) from or in connection with any information provided in or omitted from this material. Features of the FP Markets products including applicable fees and charges are outlined in the Product Disclosure Statements available from FP Markets website, www.fpmarkets.com and should be considered before deciding to deal in those products. Derivatives can be risky; losses can exceed your initial payment. FP Markets recommends that you seek independent advice. First Prudential Markets Pty Ltd trading as FP Markets ABN 16 112 600 281, Australian Financial Services License Number 286354.
Publication date:
2024-04-23 17:29:36 (GMT)
The terms and conditions of use set out below (referred to as "FX Blue's Terms"), form a contractual agreement governing FX Blue's relationship with you in relation to your use of this Website (“Agreement”) and you agree to be legally bound by FX Blue's Terms just as if you had signed this Agreement. By using this Website and any Information, you are agreeing to comply with and be bound by FX Blue's Terms, including any revisions that may be made to FX Blue's Terms from time to time. FX Blue reserves the right, in FX Blue's sole discretion, to change, modify, add or remove portions of FX Blue's Terms at any time by posting the revisions on the Website. You should check FX Blue's Terms periodically for changes as by using the Website after FX Blue posts any changes to FX Blue's Terms, you are agreeing to accept those changes, whether or not you have reviewed them, and you waive any right you may have to receive individualised notice of such changes. FX Blue's Terms may be supplemented by additional terms and conditions pertaining to specific content and activities. You agree and understand that such additional terms and conditions are hereby incorporated by reference to FX Blue's Terms. Your continued use of the Website means that you accept any new or modified FX Blue Terms.