Index and Commodities Trading week beginning 11 / 08 / 2025
 XJO WEEKLY
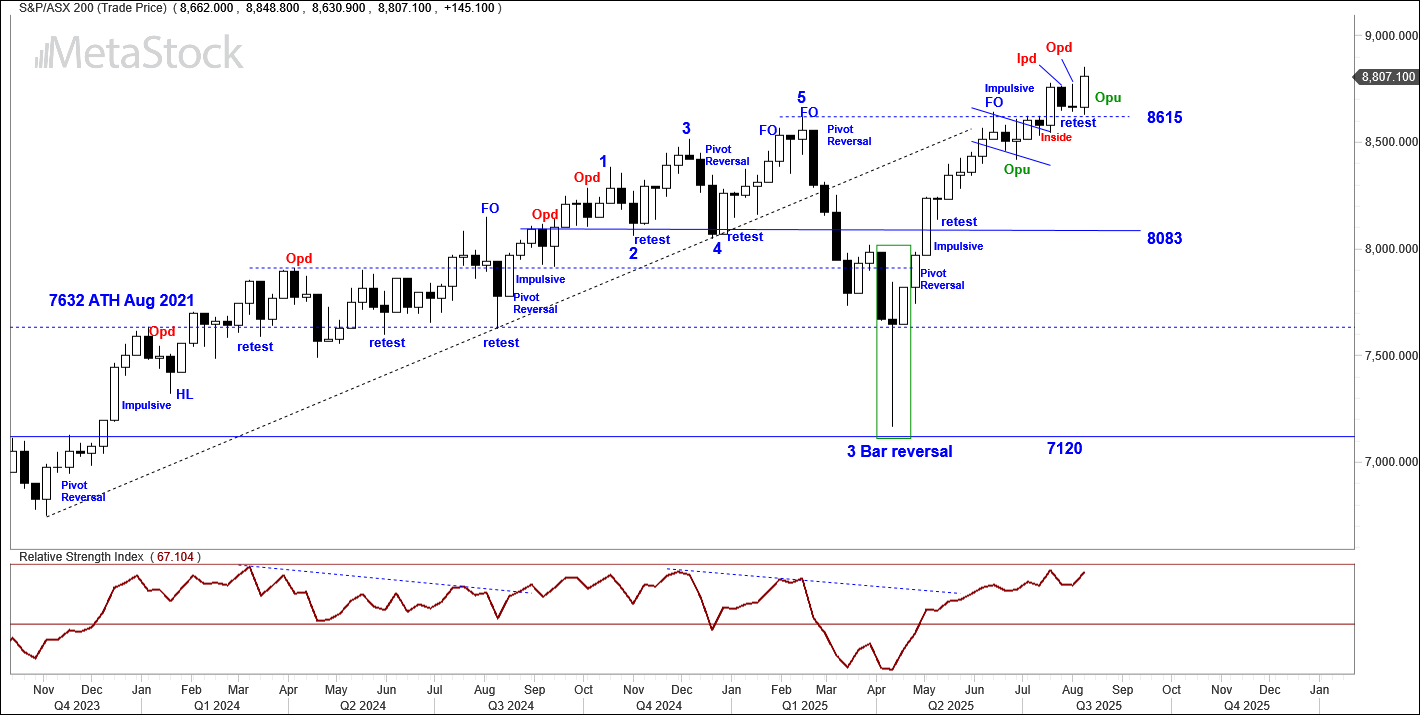
Price structure: Outside range
The recent widening of weekly ranges, punctuated by two consecutive Weekly Outside Bars, signals a notable escalation in market indecision and volatility. This pattern reflects a heightened battle between buyers and sellers, each side probing for dominance but failing to secure lasting control, classic signs of a market at a potential inflection point. The support level at 8615 is now a critical hold for the Buyers to remain confident. Currently Company reporting is underway, when the general trend of results is determined traders should expect a volatile breakout from this current consolidation area.
Indicator: Relative strength 14: Momentum on hold
Relative strength has turned higher in line with the current movement in the Index and remains above the key 50 level. Only further movements higher towards the 70 level can set a continuing bullish signal for price movements.
The RSI turning further lower to move below the 50 level, is a strong indication is for negative momentum to develop leading to Up Trend failure and further declines.
XJO WEEKLY
Price structure: Outside range
The recent widening of weekly ranges, punctuated by two consecutive Weekly Outside Bars, signals a notable escalation in market indecision and volatility. This pattern reflects a heightened battle between buyers and sellers, each side probing for dominance but failing to secure lasting control, classic signs of a market at a potential inflection point. The support level at 8615 is now a critical hold for the Buyers to remain confident. Currently Company reporting is underway, when the general trend of results is determined traders should expect a volatile breakout from this current consolidation area.
Indicator: Relative strength 14: Momentum on hold
Relative strength has turned higher in line with the current movement in the Index and remains above the key 50 level. Only further movements higher towards the 70 level can set a continuing bullish signal for price movements.
The RSI turning further lower to move below the 50 level, is a strong indication is for negative momentum to develop leading to Up Trend failure and further declines.
 Comments last week:- The Weekly inside range of 2 weeks ago has been followed by last weeks outside range closing near the low of the range. This presents a bearish setup on a break of 8615 point support. Buyers in the Bullish breakout are now faced with losses should the Index move lower. The next key support level is 8083 points. Although the market is dealing with the Macro news of Tariffs emanating from the US, the developing technical picture is Bearish until a closing price over 8776 points is registered showing buyers back in control.
XJO DAILY
Price structure: Bullish Flag developing
The Daily chart of the XJO200 has carved out a Bullish Reversal Pivot, suggesting the potential for price to break above the recent consolidation range. This pivot is not just a technical marker, it reflects a shift in market sentiment, where buyers are beginning to assert control after a period of equilibrium. Typically forms after a swing low rejection, in this case a retest of the 8615-level last Monday, often accompanied by a strong close near the high of the day as seen last Tuesday and Wednesday. This remains a bullish setup for traders working in the Daily time frame.
Indicator: Relative strength 14: Slowing momentum
The Relative strength Indicator (14) has been declining from price consolidation from below the 70 level and now moving lower indicating a loss of positive momentum within the 14 day look back period. This is typical of the RSI reading when price moves into consolidation. The impending move lower below the 50 level would indicate a loss of positive momentum and a sell signal.
Comments last week:- The Weekly inside range of 2 weeks ago has been followed by last weeks outside range closing near the low of the range. This presents a bearish setup on a break of 8615 point support. Buyers in the Bullish breakout are now faced with losses should the Index move lower. The next key support level is 8083 points. Although the market is dealing with the Macro news of Tariffs emanating from the US, the developing technical picture is Bearish until a closing price over 8776 points is registered showing buyers back in control.
XJO DAILY
Price structure: Bullish Flag developing
The Daily chart of the XJO200 has carved out a Bullish Reversal Pivot, suggesting the potential for price to break above the recent consolidation range. This pivot is not just a technical marker, it reflects a shift in market sentiment, where buyers are beginning to assert control after a period of equilibrium. Typically forms after a swing low rejection, in this case a retest of the 8615-level last Monday, often accompanied by a strong close near the high of the day as seen last Tuesday and Wednesday. This remains a bullish setup for traders working in the Daily time frame.
Indicator: Relative strength 14: Slowing momentum
The Relative strength Indicator (14) has been declining from price consolidation from below the 70 level and now moving lower indicating a loss of positive momentum within the 14 day look back period. This is typical of the RSI reading when price moves into consolidation. The impending move lower below the 50 level would indicate a loss of positive momentum and a sell signal.
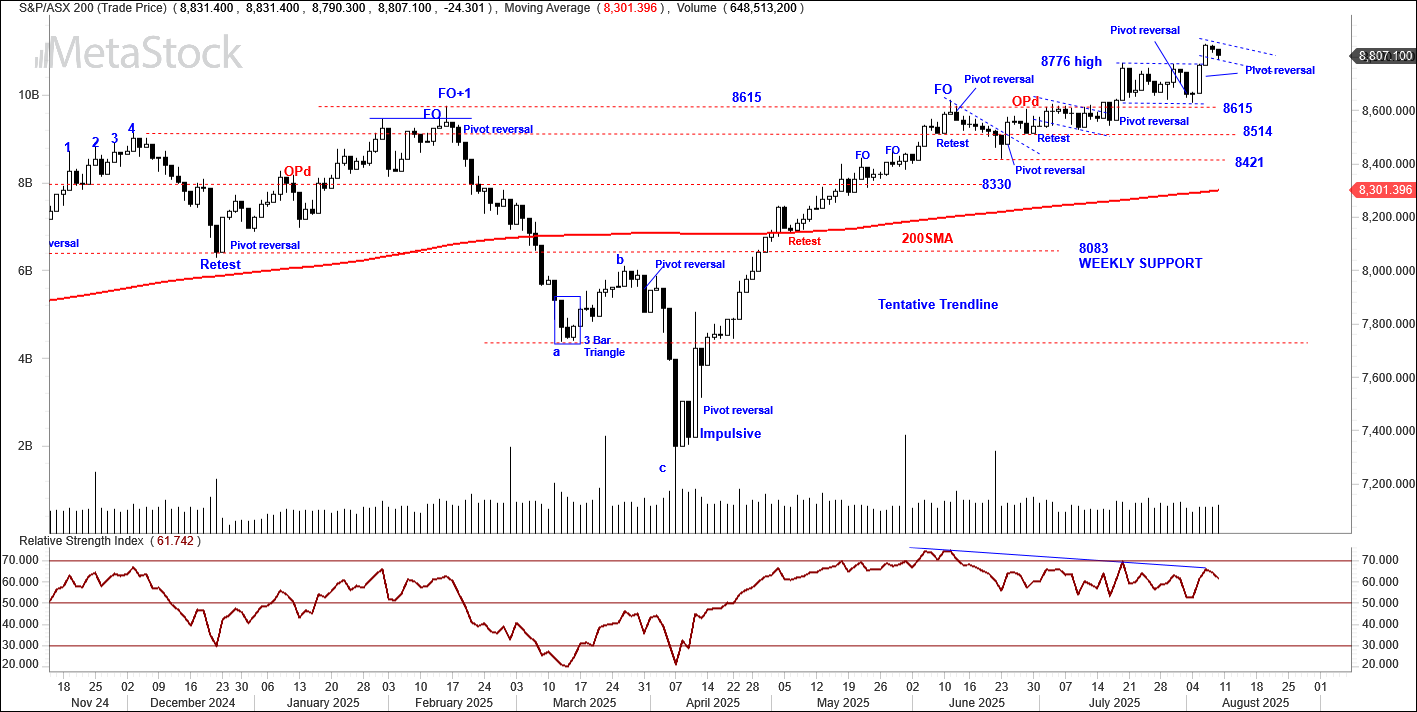 Comments last week. The Pennant continuation pattern discussed last week is now better described as a consolidation range above 8615 and below the 8776 level. Last Friday set a reversal pivot point, an early developing sell signal to be confirmed with a further daily close below 8615 points. The final bar is a large range high to low; this also adds to the bearishness of the setup and the potential to retest the 8514 level during this trading week.
S&P 500 WEEKLY: Inside range
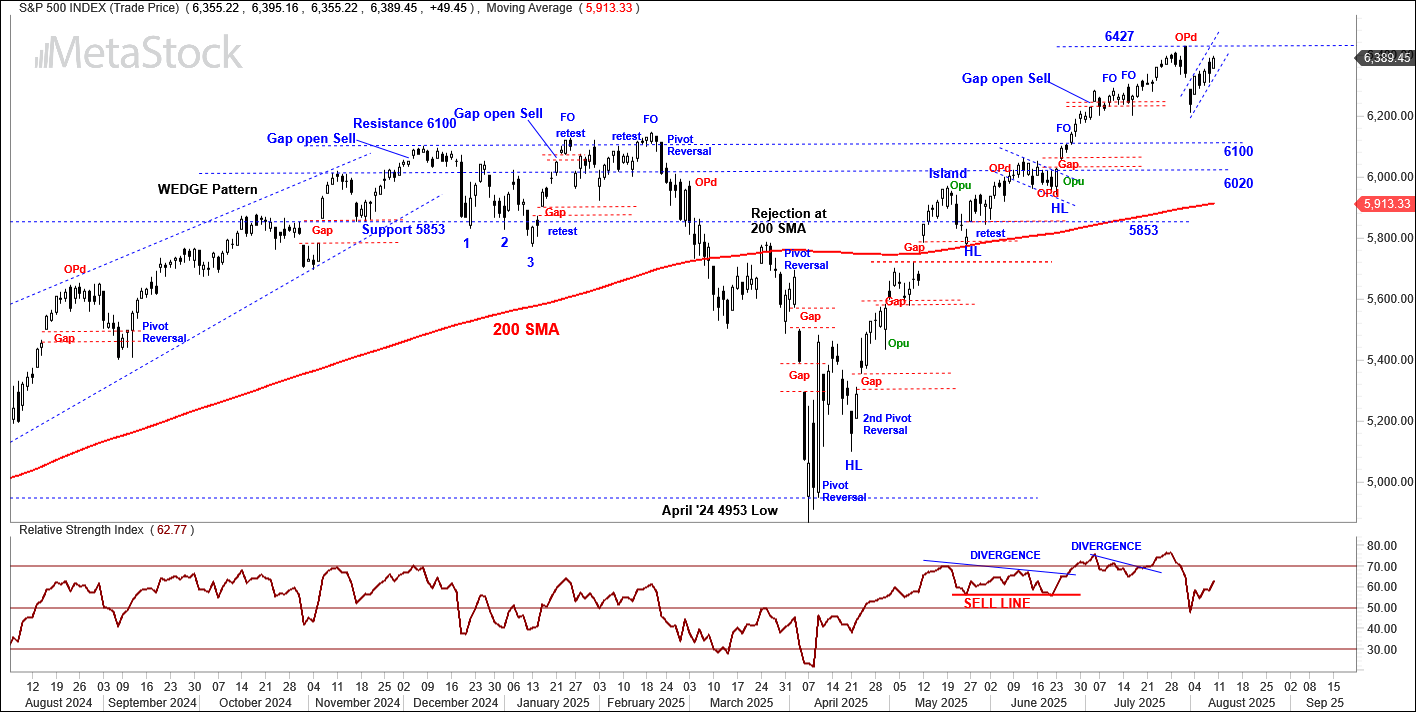
Key support remains at 8615 points, last week saw an inside range bar set, indicating buyer and sellers unable to take control of price direction. Without follow through lower from the outside range set two weeks ago, the market remains bullish, until the key Weekly support level of 6100 is broken to the downside. Top resistance is 6427 points a close over this level would be very Bullish in the direction of the current primary Up trend.
Indicator: Relative strength 14. Loss of momentum
As for continued bullish confirmation, a continuing movement back to higher levels of the 70 line on the RSI required. A continued directional move higher over the 70 level will indicate renewed strength and the potential for a renewed and continuing upside shift in momentum.
A reverse move back towards the 50 level would signal potential exhaustion among buyers, but without clear evidence of sellers stepping in, downside risks remain low.
Comments last week. The Pennant continuation pattern discussed last week is now better described as a consolidation range above 8615 and below the 8776 level. Last Friday set a reversal pivot point, an early developing sell signal to be confirmed with a further daily close below 8615 points. The final bar is a large range high to low; this also adds to the bearishness of the setup and the potential to retest the 8514 level during this trading week.
S&P 500 WEEKLY: Inside range
Key support remains at 8615 points, last week saw an inside range bar set, indicating buyer and sellers unable to take control of price direction. Without follow through lower from the outside range set two weeks ago, the market remains bullish, until the key Weekly support level of 6100 is broken to the downside. Top resistance is 6427 points a close over this level would be very Bullish in the direction of the current primary Up trend.
Indicator: Relative strength 14. Loss of momentum
As for continued bullish confirmation, a continuing movement back to higher levels of the 70 line on the RSI required. A continued directional move higher over the 70 level will indicate renewed strength and the potential for a renewed and continuing upside shift in momentum.
A reverse move back towards the 50 level would signal potential exhaustion among buyers, but without clear evidence of sellers stepping in, downside risks remain low.
 Comments from last week
The outside range that closes on the low of the session, Opd, has a statistically significant outcome for indicating a high point and the beginning of a continued reversal lower. This, following the emergence of the 2 X number 3 bar early warning sessions of 4 and 3 weeks ago, supports the view a top may be in place. First support is the 6100-breakout level. The underlying primary trend remains up until a defined lower high is set in this weekly time frame.
SPX DAILY
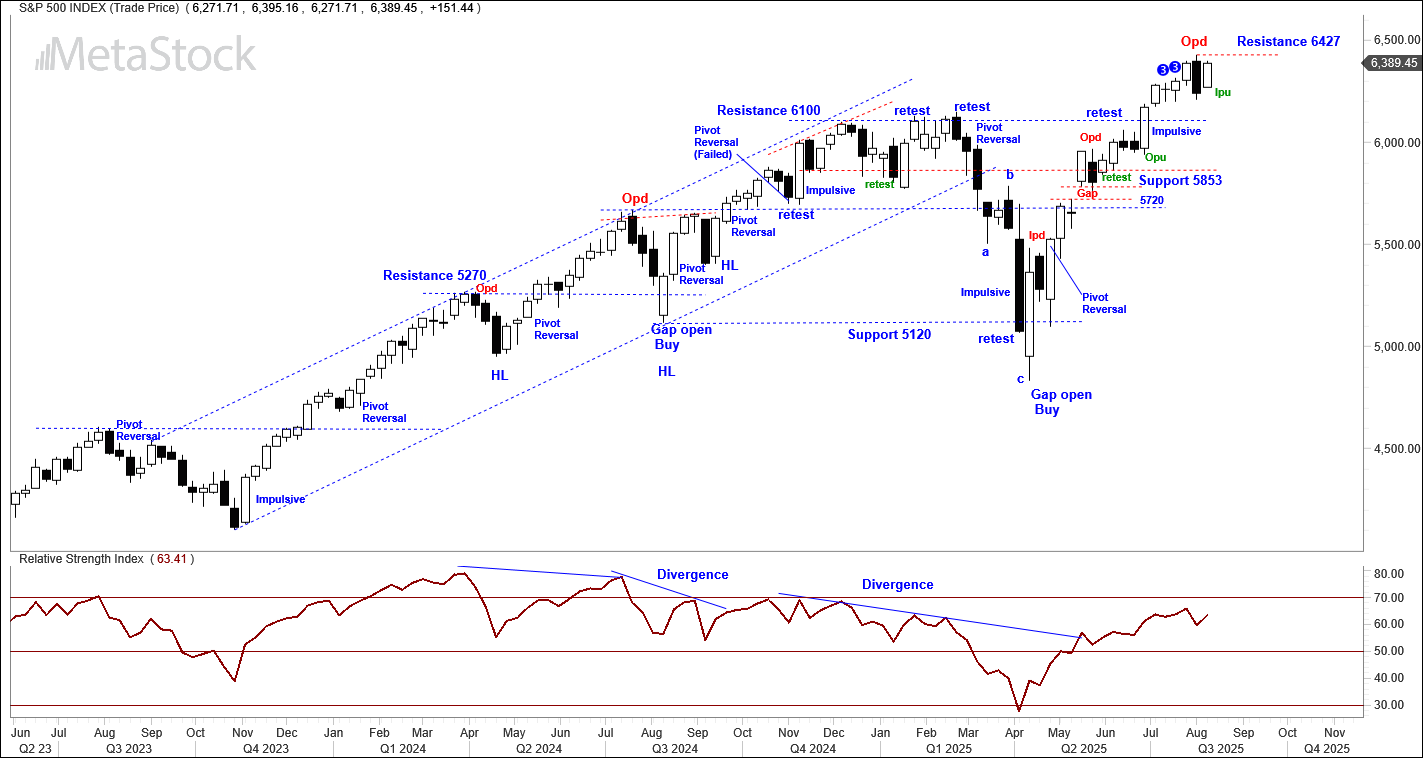
Price structure: Retest 6427
The Daily chart of the S&P 500 reveals a notable pattern of overlapping price action—where successive bars intrude upon each other’s ranges—indicating a slow, methodical grind higher rather than impulsive momentum. This type of movement often reflects a market climbing a wall of worry, with buyers cautiously advancing while sellers remain present but not dominant. It’s a classic sign of a market lacking conviction yet still leaning bullish, often seen during low-volatility uptrends or in the latter stages of a rally.
This grind appears to be targeting a retest of the 6427 level, which has emerged as a critical resistance point following its role as the high of the recent weekly Outside Bar.
A breakout higher with expanding range and volume would suggest genuine strength.
Indicator: Relative strength 14.
The Relative Strength Indicator (RSI) having moved strongly higher from the key 50 level turning in line with price action. If the RSI continues to rise from the recent point below the pivotal 50 level towards the 70 level, it will likely confirm a further Bullish outlook, leading to further UP side targets.
Comments from last week
The outside range that closes on the low of the session, Opd, has a statistically significant outcome for indicating a high point and the beginning of a continued reversal lower. This, following the emergence of the 2 X number 3 bar early warning sessions of 4 and 3 weeks ago, supports the view a top may be in place. First support is the 6100-breakout level. The underlying primary trend remains up until a defined lower high is set in this weekly time frame.
SPX DAILY
Price structure: Retest 6427
The Daily chart of the S&P 500 reveals a notable pattern of overlapping price action—where successive bars intrude upon each other’s ranges—indicating a slow, methodical grind higher rather than impulsive momentum. This type of movement often reflects a market climbing a wall of worry, with buyers cautiously advancing while sellers remain present but not dominant. It’s a classic sign of a market lacking conviction yet still leaning bullish, often seen during low-volatility uptrends or in the latter stages of a rally.
This grind appears to be targeting a retest of the 6427 level, which has emerged as a critical resistance point following its role as the high of the recent weekly Outside Bar.
A breakout higher with expanding range and volume would suggest genuine strength.
Indicator: Relative strength 14.
The Relative Strength Indicator (RSI) having moved strongly higher from the key 50 level turning in line with price action. If the RSI continues to rise from the recent point below the pivotal 50 level towards the 70 level, it will likely confirm a further Bullish outlook, leading to further UP side targets.
 Comments from last week: The high Gap open and immediate sell down set an outside range last Thursday followed through by the Gap down on Friday. The Two large range bars indicate Buyers have lost control of price setting. The 6100-breakout level could be challenged this week, failure of the Index to hold this level may see a further retest of the 6020 Support/ Resistance level with the further potential to retest the 200 day moving average.
NASDAQ (100) DAILY Price structure: New high
The Nasdaq has surged to a new all-time high, a move set by the pivot reversal bar established last Monday. That bar marked a decisive inflection point in the index’s short-term trajectory, signalling a shift in control from Sellers to Buyers.
The reversal emerged after a brief sharp pullback into a minor support zone, where price had been compressing within a tight range. The bar itself displayed strong bullish intent
This breakout to new highs carries psychological and structural weight. Psychologically, all-time highs tend to attract momentum traders and institutional flows, as they represent uncharted territory devoid of overhead supply.
Structurally, the move confirms the validity of the pivot reversal as a launchpad, reinforcing the notion that buyers are willing to defend dips and press advantage when given the opportunity.
However, while the breakout is impressive, it’s worth noting the character of the move. If the ascent continues with expanding range and volume, it will point to a healthy high conviction move getting underway.
Indicator: Relative strength 14: Sell Signal
The Relative Strength Index (RSI) has now turned sharply higher which signals increasing Bullish momentum. With the RSI falling from the 70 level a Divergence is complete, however it would serve as a strong Bearish indicator on a further decline, this is highlighting a loss of momentum may be underway as the market makes a sharp reversal, market participants cannot afford to overlook this outcome.
Comments from last week: The high Gap open and immediate sell down set an outside range last Thursday followed through by the Gap down on Friday. The Two large range bars indicate Buyers have lost control of price setting. The 6100-breakout level could be challenged this week, failure of the Index to hold this level may see a further retest of the 6020 Support/ Resistance level with the further potential to retest the 200 day moving average.
NASDAQ (100) DAILY Price structure: New high
The Nasdaq has surged to a new all-time high, a move set by the pivot reversal bar established last Monday. That bar marked a decisive inflection point in the index’s short-term trajectory, signalling a shift in control from Sellers to Buyers.
The reversal emerged after a brief sharp pullback into a minor support zone, where price had been compressing within a tight range. The bar itself displayed strong bullish intent
This breakout to new highs carries psychological and structural weight. Psychologically, all-time highs tend to attract momentum traders and institutional flows, as they represent uncharted territory devoid of overhead supply.
Structurally, the move confirms the validity of the pivot reversal as a launchpad, reinforcing the notion that buyers are willing to defend dips and press advantage when given the opportunity.
However, while the breakout is impressive, it’s worth noting the character of the move. If the ascent continues with expanding range and volume, it will point to a healthy high conviction move getting underway.
Indicator: Relative strength 14: Sell Signal
The Relative Strength Index (RSI) has now turned sharply higher which signals increasing Bullish momentum. With the RSI falling from the 70 level a Divergence is complete, however it would serve as a strong Bearish indicator on a further decline, this is highlighting a loss of momentum may be underway as the market makes a sharp reversal, market participants cannot afford to overlook this outcome.
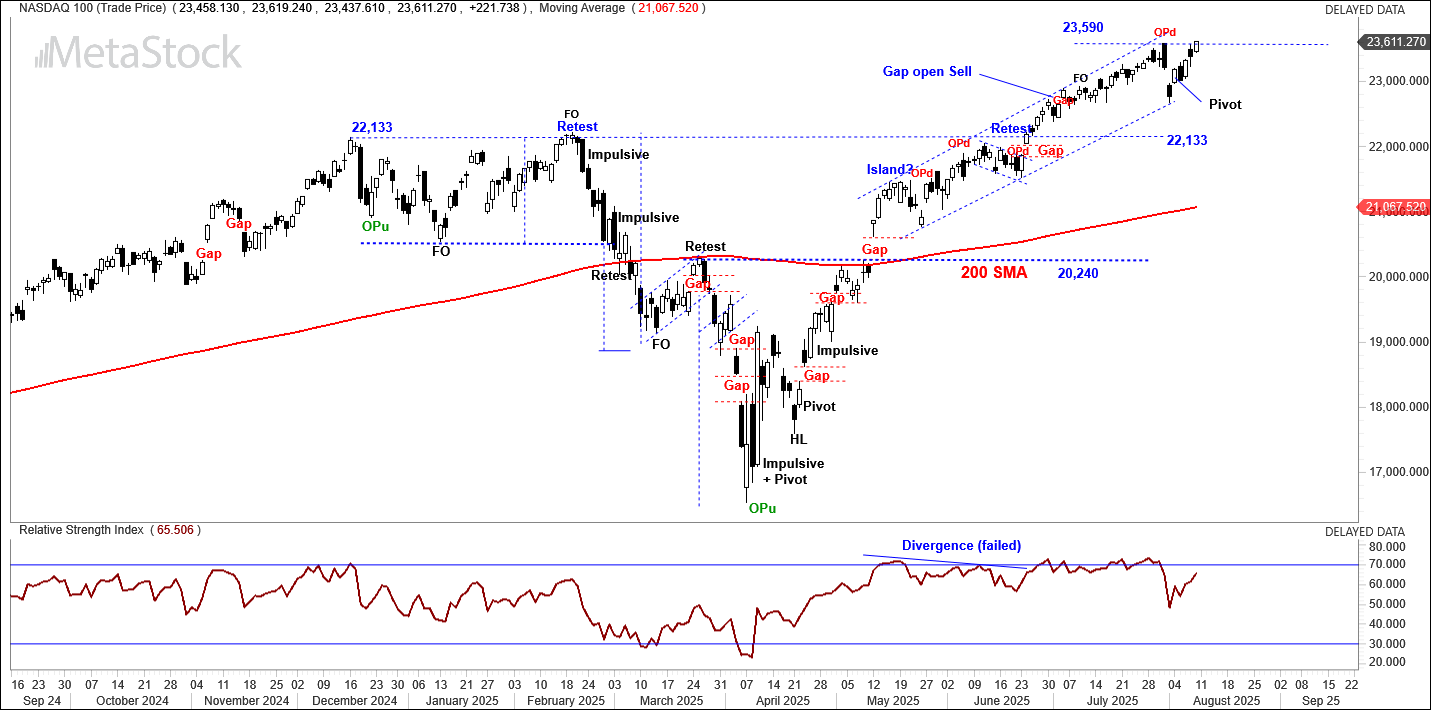 Comments from last week The Gap open last Thursday followed by the Gap down in last Friday’s trading session sets up the Index to trade lower out of the current ascending channel. First support remains at 22,133 points and further price targets into the 22,000-point open Gap area. From the emergence of this price channel in May25’ Daily price advances have been weak. The current 2 day move down has been achieved with 2 large range moves, profit taking may see the Index move lower to test the 200 day moving average.
USD Spot GOLD – DAILY:
Gold continues to consolidate beneath the formidable $3431 resistance level, a price zone that has repeatedly capped upward momentum and now serves as a structural ceiling.
Recently, price broke below a well-defined ascending trendline that had been supporting the advance for several weeks. At first glance, this breakdown appeared to signal a shift in tone, perhaps the beginning of a deeper correction. However, the market’s response was swift and telling. Immediate buying pressure emerged just beneath the trendline breach, resulting in the formation of a Pivot bar, a classic reversal structure characterized by the previous lower low and a strong close over the high. This bar didn’t just halt the decline, it reasserted bullish intent and lifted price back into the prior consolidation range.
This current consolidation phase is marked by a series of compressed bars and hesitant follow-through, suggesting a market in equilibrium, neither ready to capitulate nor yet prepared to break higher.
The proximity to the $3431 resistance also keeps the option open for further distribution.
Indicator: Relative Strength 14: Bullish momentum
The RSI has reversed back higher through the 50 level, just, this is turning into a Bullish reading. Should the RSI reading further increase in the coming week towards the 70 level this will reflect an outright Buy signal. Short term holders and traders should continue to monitor the RSI for a movement remaining above the 50 level as a Buy signal.
Comments from last week The Gap open last Thursday followed by the Gap down in last Friday’s trading session sets up the Index to trade lower out of the current ascending channel. First support remains at 22,133 points and further price targets into the 22,000-point open Gap area. From the emergence of this price channel in May25’ Daily price advances have been weak. The current 2 day move down has been achieved with 2 large range moves, profit taking may see the Index move lower to test the 200 day moving average.
USD Spot GOLD – DAILY:
Gold continues to consolidate beneath the formidable $3431 resistance level, a price zone that has repeatedly capped upward momentum and now serves as a structural ceiling.
Recently, price broke below a well-defined ascending trendline that had been supporting the advance for several weeks. At first glance, this breakdown appeared to signal a shift in tone, perhaps the beginning of a deeper correction. However, the market’s response was swift and telling. Immediate buying pressure emerged just beneath the trendline breach, resulting in the formation of a Pivot bar, a classic reversal structure characterized by the previous lower low and a strong close over the high. This bar didn’t just halt the decline, it reasserted bullish intent and lifted price back into the prior consolidation range.
This current consolidation phase is marked by a series of compressed bars and hesitant follow-through, suggesting a market in equilibrium, neither ready to capitulate nor yet prepared to break higher.
The proximity to the $3431 resistance also keeps the option open for further distribution.
Indicator: Relative Strength 14: Bullish momentum
The RSI has reversed back higher through the 50 level, just, this is turning into a Bullish reading. Should the RSI reading further increase in the coming week towards the 70 level this will reflect an outright Buy signal. Short term holders and traders should continue to monitor the RSI for a movement remaining above the 50 level as a Buy signal.
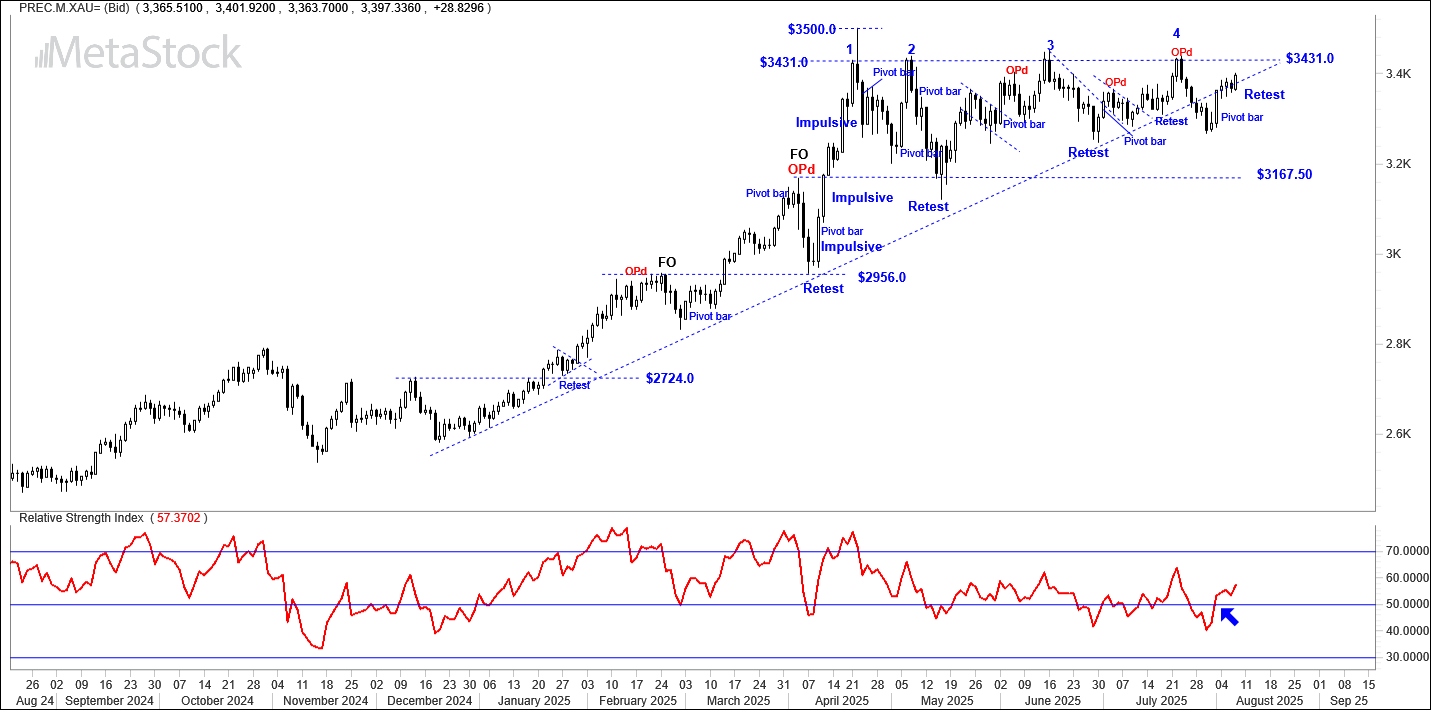 Comments from last week: The ascending pattern discussed in the past Weeks has now resolved into a simple trading range as price action moves past the key 2/3 point and trades below the ascending trendline.
Last Friday set a Bullish pivot point reversal with the potential to trade high higher in the early sessions this week. Traders should look for a retest of the $3431.0 resistance high following this current retest of the trendline.
AUD GOLD – DAILY: Pennant pattern.
Consolidation continues within the developing Pennant pattern. Traders should monitor this pattern for a close over the $5287 closing high as a signal of continued support. Australian Gold producers will be favoured on continuing strength is this chart.
Indicator: Relative Strength 14: Bearish
The Relative Strength Index (RSI) is showing an upturn from the 60 level, and the reading remains above the key 50 midpoint. Momentum is slowly turning higher as the Pennant price pattern develops, a further close above the 70 level would indicate momentum has turned Bullish. Traders are advised to watch for any minor pullbacks as potential buying opportunities within this broader uptrend of Gold producers, as the overall market sentiment remains strongly in favour of continued gains.
Comments from last week: The ascending pattern discussed in the past Weeks has now resolved into a simple trading range as price action moves past the key 2/3 point and trades below the ascending trendline.
Last Friday set a Bullish pivot point reversal with the potential to trade high higher in the early sessions this week. Traders should look for a retest of the $3431.0 resistance high following this current retest of the trendline.
AUD GOLD – DAILY: Pennant pattern.
Consolidation continues within the developing Pennant pattern. Traders should monitor this pattern for a close over the $5287 closing high as a signal of continued support. Australian Gold producers will be favoured on continuing strength is this chart.
Indicator: Relative Strength 14: Bearish
The Relative Strength Index (RSI) is showing an upturn from the 60 level, and the reading remains above the key 50 midpoint. Momentum is slowly turning higher as the Pennant price pattern develops, a further close above the 70 level would indicate momentum has turned Bullish. Traders are advised to watch for any minor pullbacks as potential buying opportunities within this broader uptrend of Gold producers, as the overall market sentiment remains strongly in favour of continued gains.
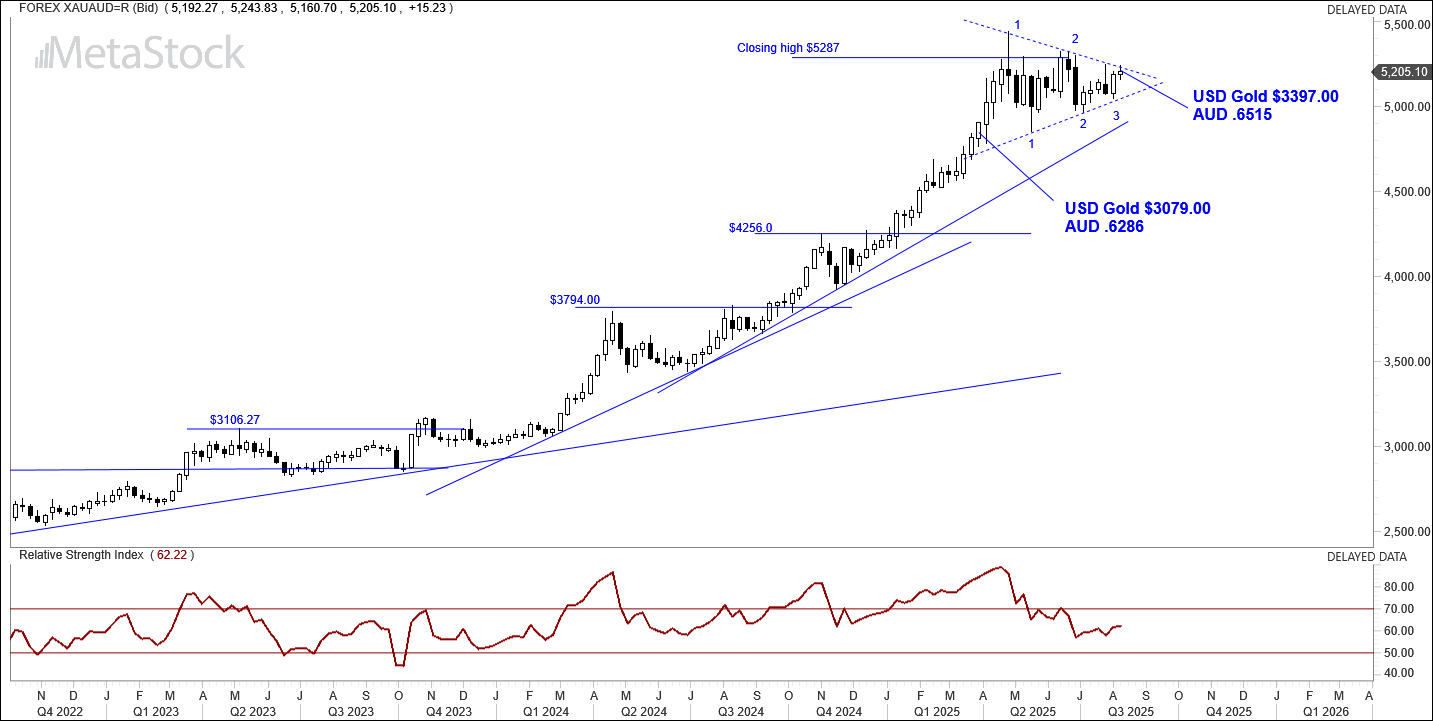 Comments from last week. Further consolidation within the developing Pennant pattern. Traders should monitor this pattern for a close over the $5287 closing high as a signal of continued support. Australian Gold producers will remain under pressure as this consolidation takes place.
SILVER Price structure: Pivot reversal
From the observation last week, price has immediately reversed higher towards the $39.15 resistance level. This is a very positive outcome from the recent Fake out, FO, high point retracement. Silver remains within a strong Primary UP trend. Traders should look for a further close over the $39.15 level to confirm a continuation move is underway. USD Silver can develop into trading ranges.
Relative strength 14: Positive swing
The relative strength index (RSI) has moved higher to align with the Pivot reversal price rally from the $36.00 level. The current move higher has moved the RSI above the 50 level. This movement indicates a directional increase of momentum and sets a Bullish continuation signal.
Comments from last week. Further consolidation within the developing Pennant pattern. Traders should monitor this pattern for a close over the $5287 closing high as a signal of continued support. Australian Gold producers will remain under pressure as this consolidation takes place.
SILVER Price structure: Pivot reversal
From the observation last week, price has immediately reversed higher towards the $39.15 resistance level. This is a very positive outcome from the recent Fake out, FO, high point retracement. Silver remains within a strong Primary UP trend. Traders should look for a further close over the $39.15 level to confirm a continuation move is underway. USD Silver can develop into trading ranges.
Relative strength 14: Positive swing
The relative strength index (RSI) has moved higher to align with the Pivot reversal price rally from the $36.00 level. The current move higher has moved the RSI above the 50 level. This movement indicates a directional increase of momentum and sets a Bullish continuation signal.
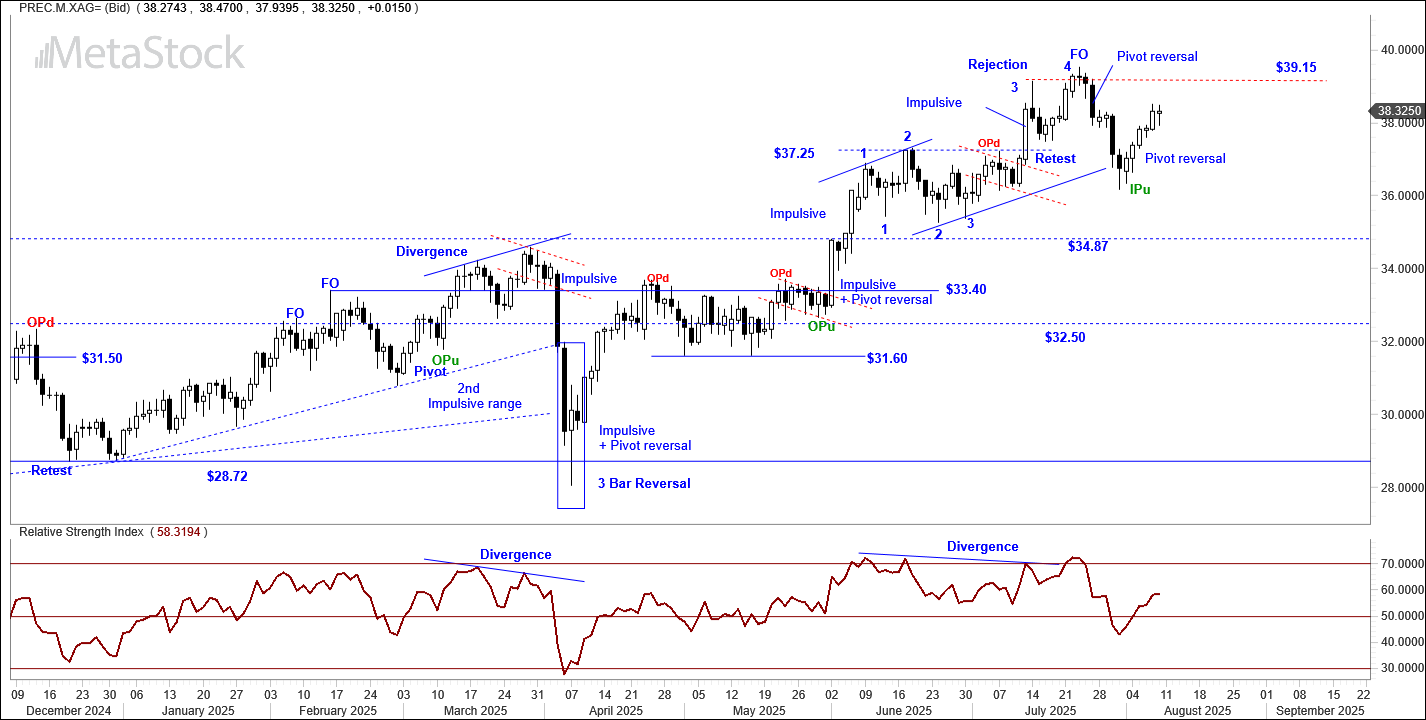 Comments from last week. Failure of the $37.25 breakout level to provide support in this current Daily price decline may see Silver decline further to retest the $34.87 breakout level. As the current price declines have moved below the July 24th low the current move is now considered a corrective move as sellers take control of price direction.
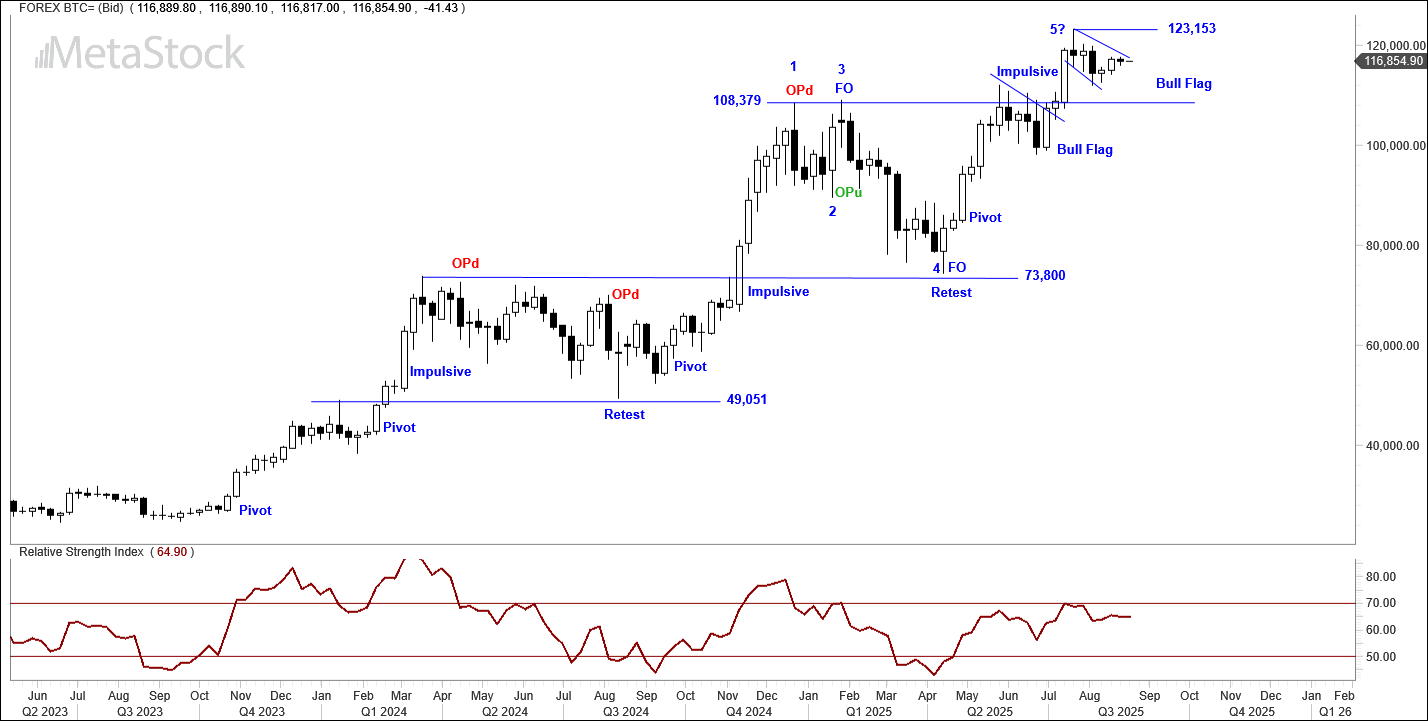
BITCOIN
Bull Flag
The price action in Bitcoin continues to develop into a Bullish flag pattern as price grinds lower towards a retest of the $108,379 breakout level. A further close over $123,153 would signal a continuation of the underlying Primary UP trend.
A closing price below the breakout level of $108,379 would show sellers have price control, the current Bearish Wave pattern remains under watch.
Relative strength 14: Neutral
Relative Strength remains in sync with the underlying price movements. Although momentum is slowing in line with price consolidation the RSI remains above the key 50 level.
Comments from last week. Failure of the $37.25 breakout level to provide support in this current Daily price decline may see Silver decline further to retest the $34.87 breakout level. As the current price declines have moved below the July 24th low the current move is now considered a corrective move as sellers take control of price direction.
BITCOIN
Bull Flag
The price action in Bitcoin continues to develop into a Bullish flag pattern as price grinds lower towards a retest of the $108,379 breakout level. A further close over $123,153 would signal a continuation of the underlying Primary UP trend.
A closing price below the breakout level of $108,379 would show sellers have price control, the current Bearish Wave pattern remains under watch.
Relative strength 14: Neutral
Relative Strength remains in sync with the underlying price movements. Although momentum is slowing in line with price consolidation the RSI remains above the key 50 level.
 Comments from last week.
Currently Bitcoin is developing a bullish flag pattern, this will confirm as a breakout with a close over the $123,153 high however since the November 2024 impulsive breakout, Bitcoin has been forming higher highs and lower lows, a hallmark of a Bearish expanding wave pattern with the 5th wave still in development. Should price move below the $108,379 level the flag will have failed, offering sellers directional control to take price back to the $100,000 level.
Comments from last week.
Currently Bitcoin is developing a bullish flag pattern, this will confirm as a breakout with a close over the $123,153 high however since the November 2024 impulsive breakout, Bitcoin has been forming higher highs and lower lows, a hallmark of a Bearish expanding wave pattern with the 5th wave still in development. Should price move below the $108,379 level the flag will have failed, offering sellers directional control to take price back to the $100,000 level.Publication date:
2025-08-11 15:49:00 (GMT)