The Pattern Pulse – 27 February 2025
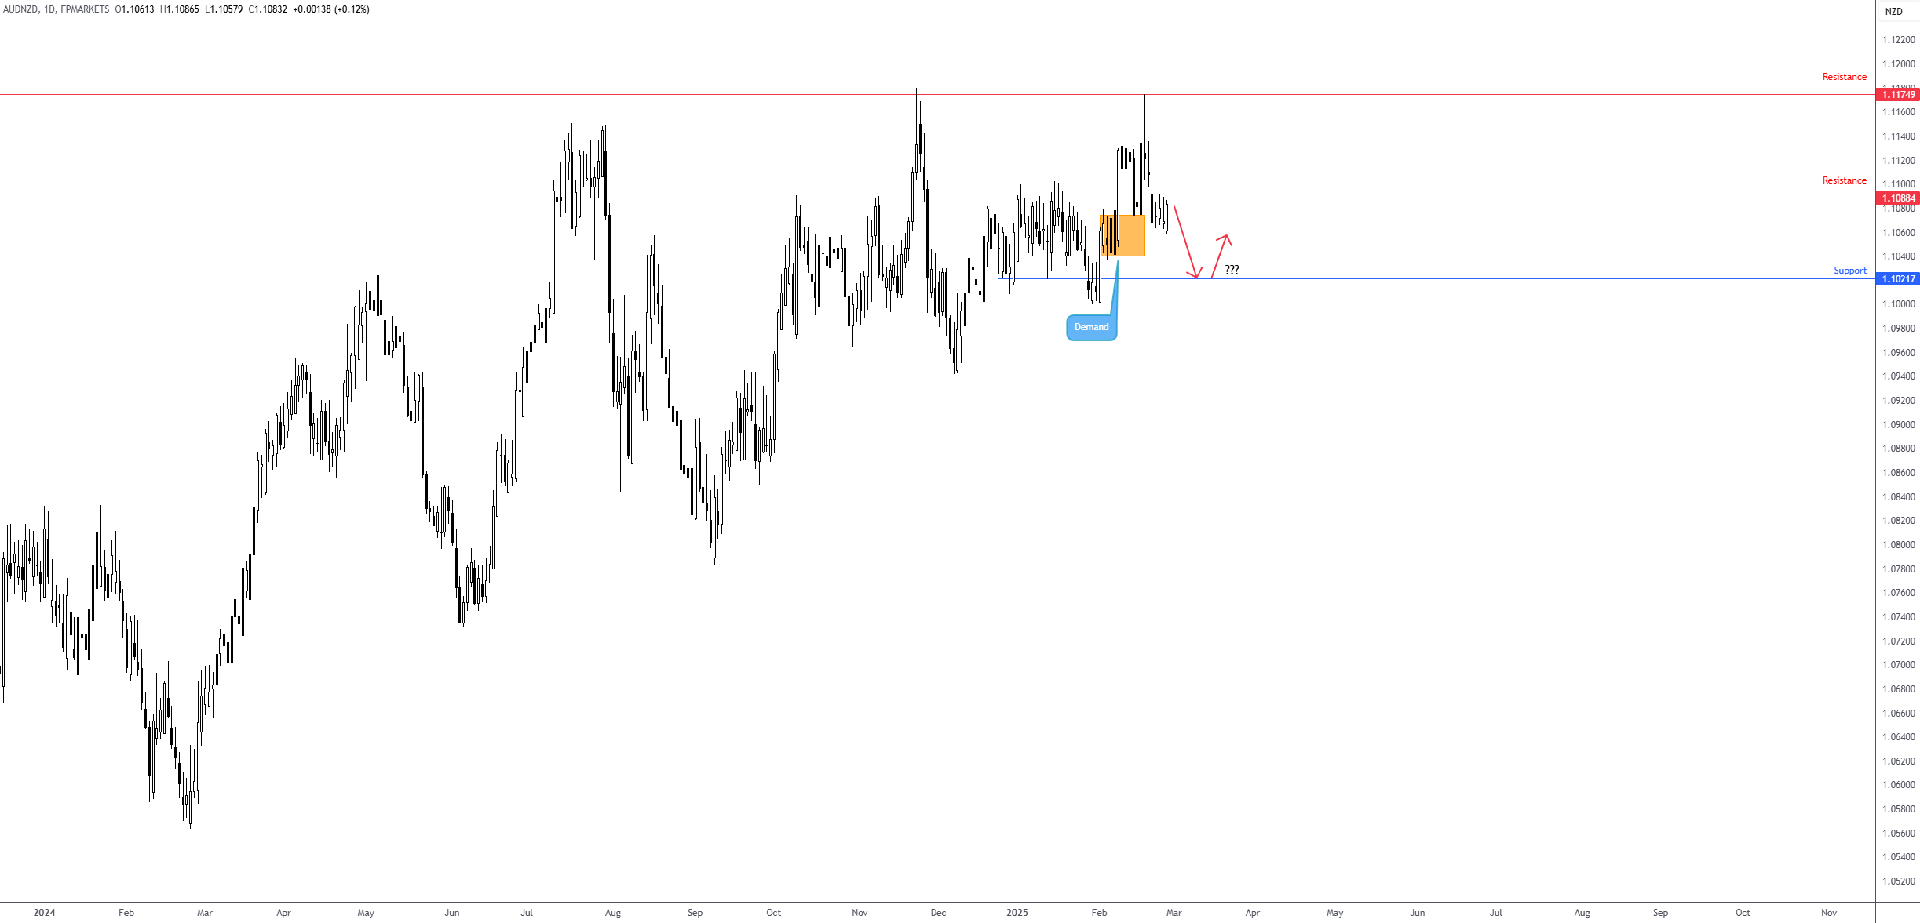
Forex: AUD/NZD Whipsaw Brewing?
Daily Timeframe:
The AUD/NZD cross (Australian dollar versus the New Zealand dollar) recently faded long-term daily resistance from NZ$1.1175 and probed below daily support at NZ$1.1088 (now marked resistance). The area I highlighted in orange between NZ$1.1040 and NZ$1.1074 will likely be considered robust demand in light of the base holding firm on 18 February. So, with protective stop loss orders likely positioned beneath this zone (sell stops), a break of the noted demand could trigger a short-term whipsaw from support at NZ$1.1022 (red arrows).
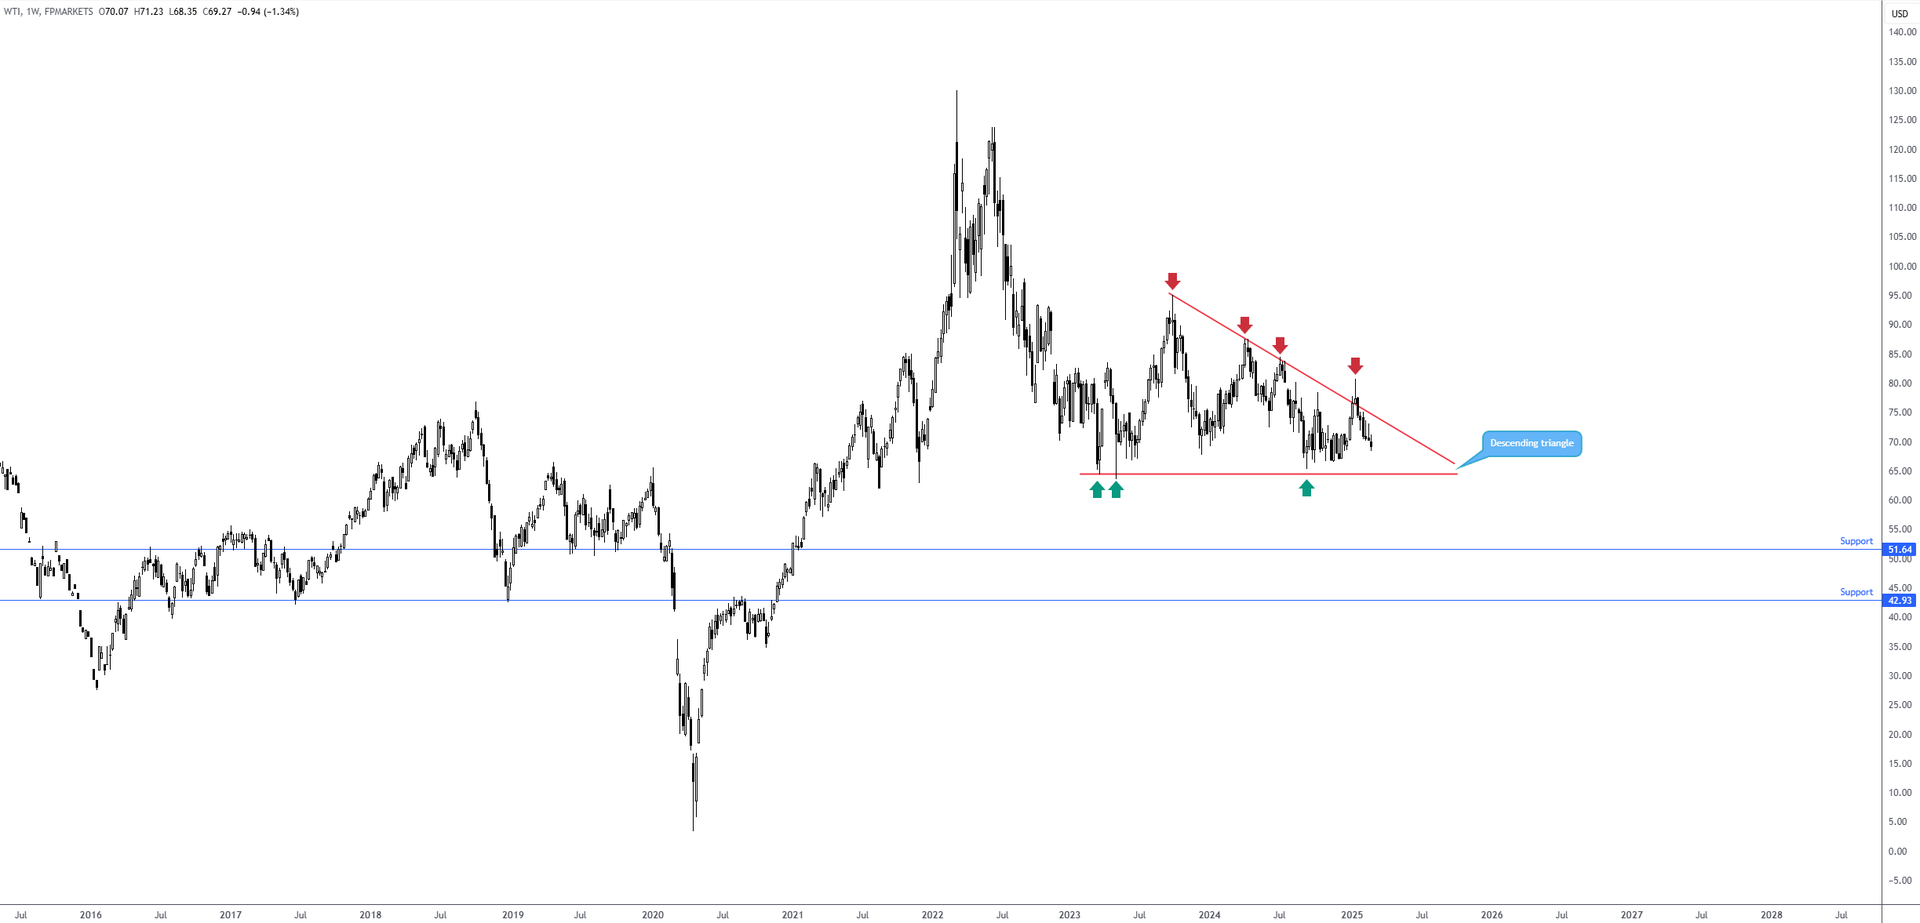
 Commodities: WTI Oil Approaching the Lower Boundary of a Descending Triangle
Weekly Timeframe:
WTI Oil (West Texas Intermediate) is on track to record a sixth consecutive week in the red, directing attention to the lower boundary of a descending triangle, extended from the low of US$64.34. As such, with further downside potentially on the table, investors will likely be looking at longer-term support levels to target in the event of a breakout lower. From my perspective, two prominent support areas are seen as far south as US$51.64 and US$42.93.
Commodities: WTI Oil Approaching the Lower Boundary of a Descending Triangle
Weekly Timeframe:
WTI Oil (West Texas Intermediate) is on track to record a sixth consecutive week in the red, directing attention to the lower boundary of a descending triangle, extended from the low of US$64.34. As such, with further downside potentially on the table, investors will likely be looking at longer-term support levels to target in the event of a breakout lower. From my perspective, two prominent support areas are seen as far south as US$51.64 and US$42.93.
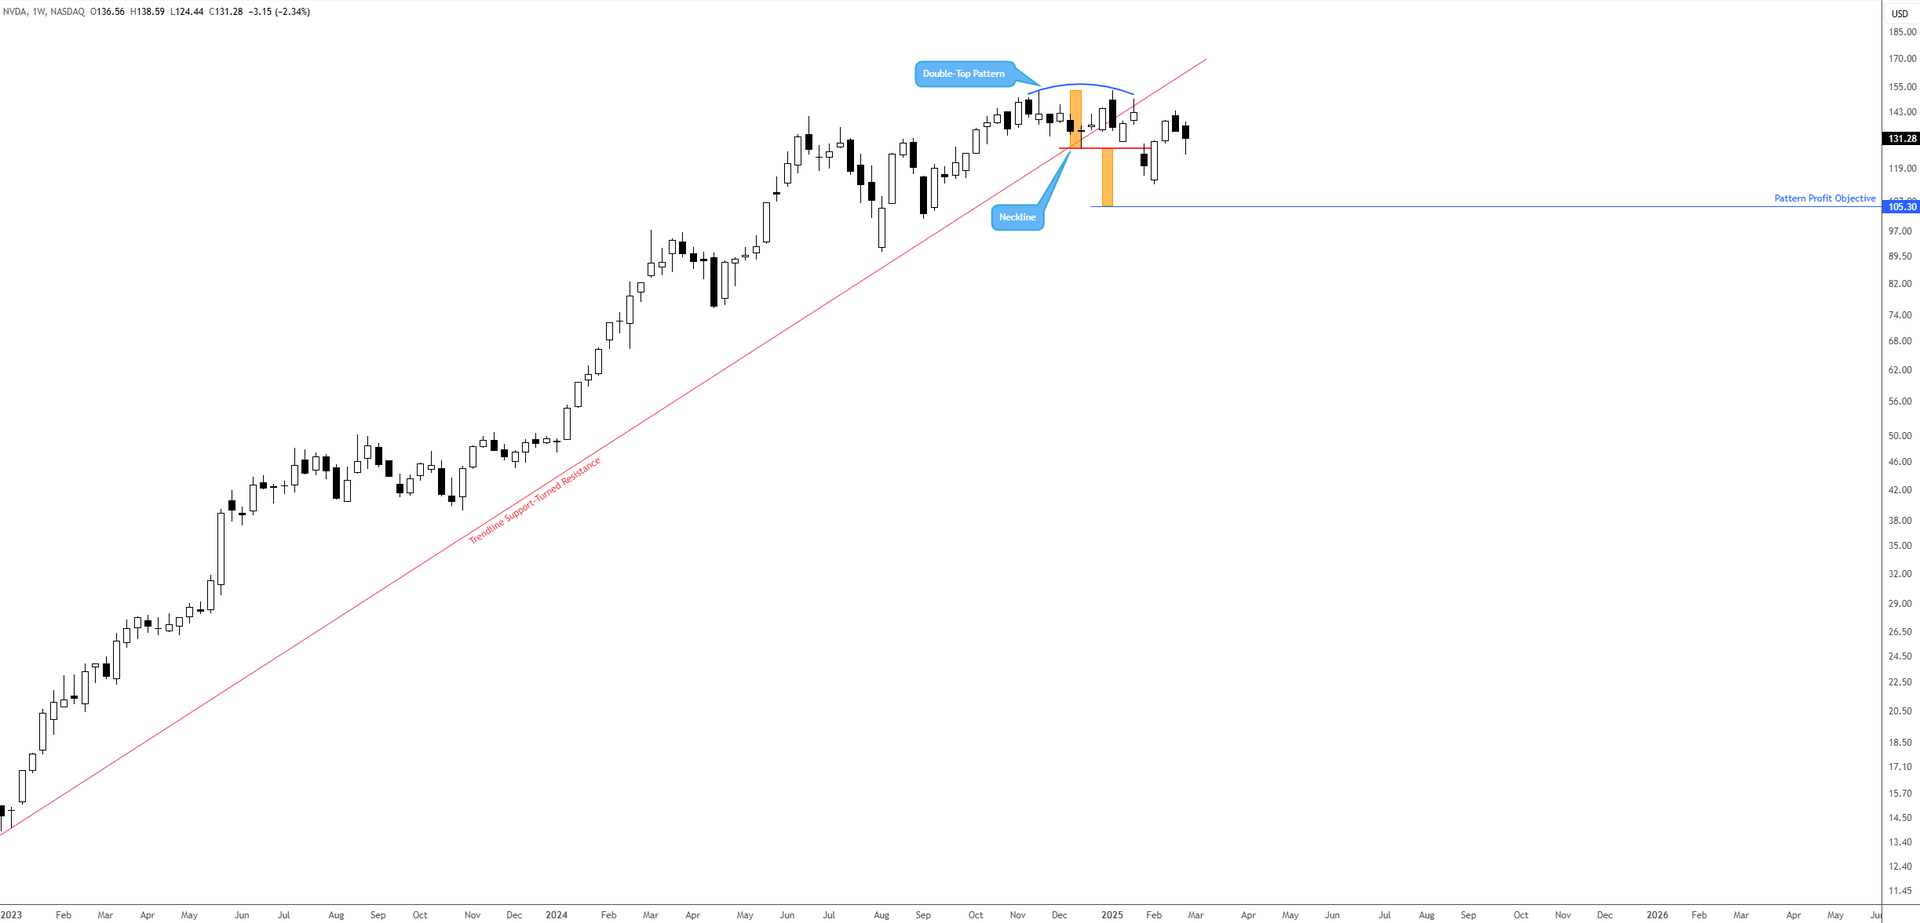
 Equities: Nvidia Eyeing Double-Top Profit Objective?
Weekly Timeframe:
Despite Nvidia (ticker: NVDA) smashing forecasts in its first financial results of the year after the market closed yesterday, the Stock’s technical picture remains unchanged. Following an all-time high of US$153.13 at the beginning of the year, the Stock established the start of a double-top pattern that was recently completed (the neckline was breached, a horizontal line taken from the low of US$126.86). Consequently, given the pattern’s profit objective calling for attention to the downside at US$105.30, and the break of weekly trendline support (taken from US$10.81), I feel there is scope for a push lower to around the US$105ish region.
Equities: Nvidia Eyeing Double-Top Profit Objective?
Weekly Timeframe:
Despite Nvidia (ticker: NVDA) smashing forecasts in its first financial results of the year after the market closed yesterday, the Stock’s technical picture remains unchanged. Following an all-time high of US$153.13 at the beginning of the year, the Stock established the start of a double-top pattern that was recently completed (the neckline was breached, a horizontal line taken from the low of US$126.86). Consequently, given the pattern’s profit objective calling for attention to the downside at US$105.30, and the break of weekly trendline support (taken from US$10.81), I feel there is scope for a push lower to around the US$105ish region.
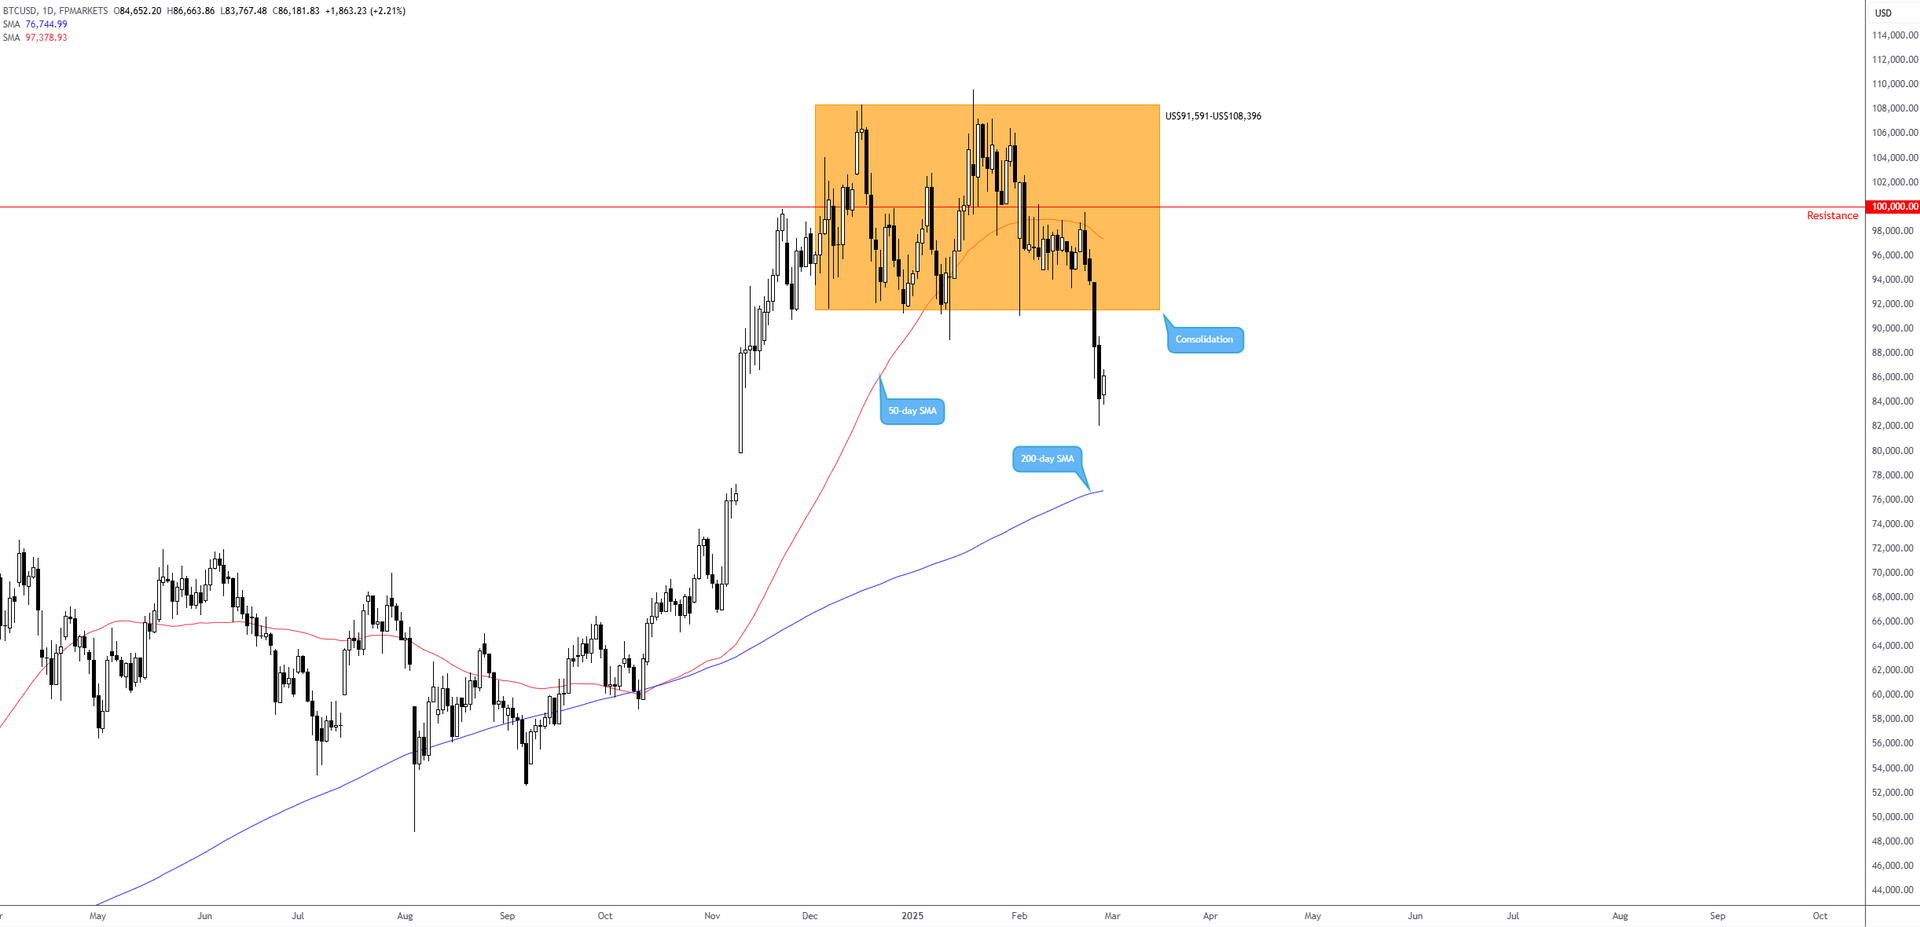
 Cryptocurrency: BTC/USD Bulls Under Pressure
Daily Timeframe:
From the daily timeframe of BTC/USD (Bitcoin versus the US dollar), price action recently breached the lower limit of a near-three-month consolidation between US$108,396 and US$91,591. Following this one-sided break – involving four consecutive losing days – the major Cryptocurrency pair could experience further underperformance in view of the limited support until the 200-day simple moving average at US$76,744.
Cryptocurrency: BTC/USD Bulls Under Pressure
Daily Timeframe:
From the daily timeframe of BTC/USD (Bitcoin versus the US dollar), price action recently breached the lower limit of a near-three-month consolidation between US$108,396 and US$91,591. Following this one-sided break – involving four consecutive losing days – the major Cryptocurrency pair could experience further underperformance in view of the limited support until the 200-day simple moving average at US$76,744.
 Charts created using TradingView
Written by FP Markets Market Analyst Aaron Hill
Charts created using TradingView
Written by FP Markets Market Analyst Aaron Hill Publication date:
2025-02-27 11:29:35 (GMT)