Index and Commodities Trading week beginning 14 / 04 / 2025
 XJO WEEKLY
Price structure: Bullish reversal
The Index has demonstrated a solid recovery, marked by a robust candle formation that has successfully closed above the significant August 2021 high of 7,632 points. This achievement signals a noteworthy rebound from the retest low towards 7120, this could indicate renewed upward momentum in this volatile market. Breaking through this key resistance level not only highlights the strength of the recovery but also underscores the potential for continued bullish sentiment among investors.
Indicator: Relative strength 14: Declining upward momentum.
Relative strength has turned sideways in line with the reversal higher in the Index and has remained below the key 50 level for 6 weeks. Only further movements higher towards the 50 and 70 level can set a continuing bullish signal for price movements.
The RSI turning further lower to move below the 30 level, is a strong indication is for negative momentum to develop leading to Up Trend failure and further declines.
XJO WEEKLY
Price structure: Bullish reversal
The Index has demonstrated a solid recovery, marked by a robust candle formation that has successfully closed above the significant August 2021 high of 7,632 points. This achievement signals a noteworthy rebound from the retest low towards 7120, this could indicate renewed upward momentum in this volatile market. Breaking through this key resistance level not only highlights the strength of the recovery but also underscores the potential for continued bullish sentiment among investors.
Indicator: Relative strength 14: Declining upward momentum.
Relative strength has turned sideways in line with the reversal higher in the Index and has remained below the key 50 level for 6 weeks. Only further movements higher towards the 50 and 70 level can set a continuing bullish signal for price movements.
The RSI turning further lower to move below the 30 level, is a strong indication is for negative momentum to develop leading to Up Trend failure and further declines.
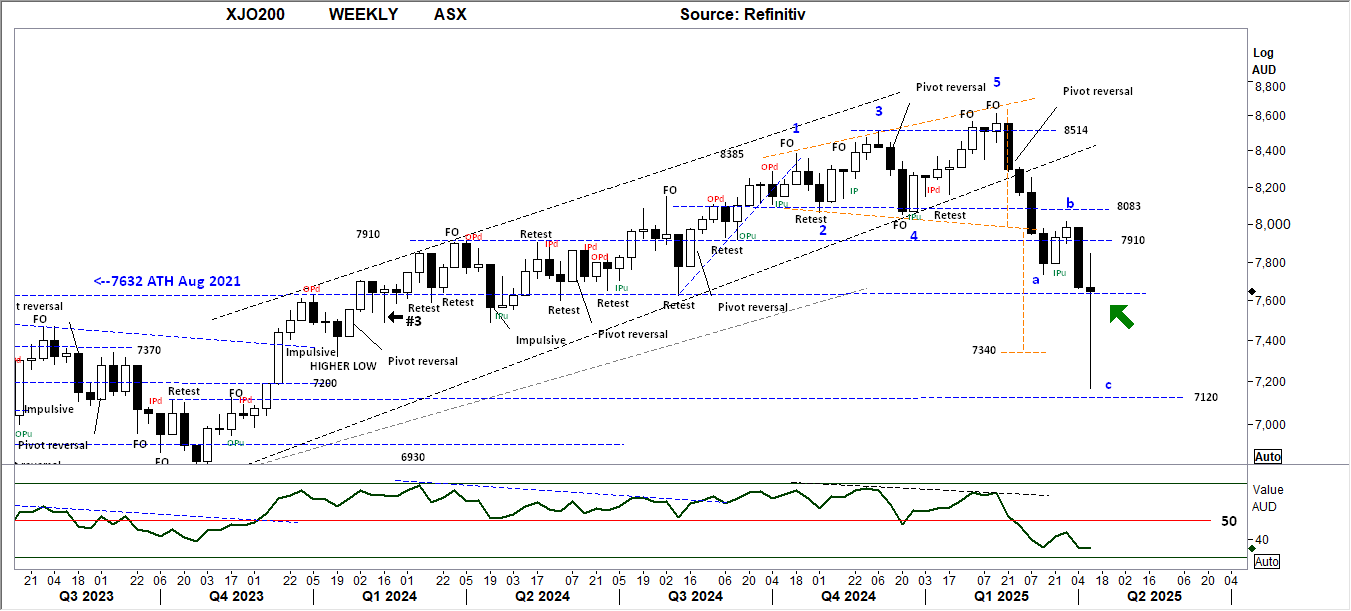 Comments last week:- The potential a,b,c pattern highlighted in the past 2 weeks, is now confirmed with the Index closing below the “a” point low, the “c” wave is now underway. The Index has moved lower through the key 7910 level to target the 7632 support level. The potential for a further 5% decline to reach the projected target range of 7340 -7400 points remains. The XJO has now entered into a Primary down trend. The XJO index is in a Bear market confirmed by a Primary down trend in the Materials and Financial indices along with Emerging market Index.
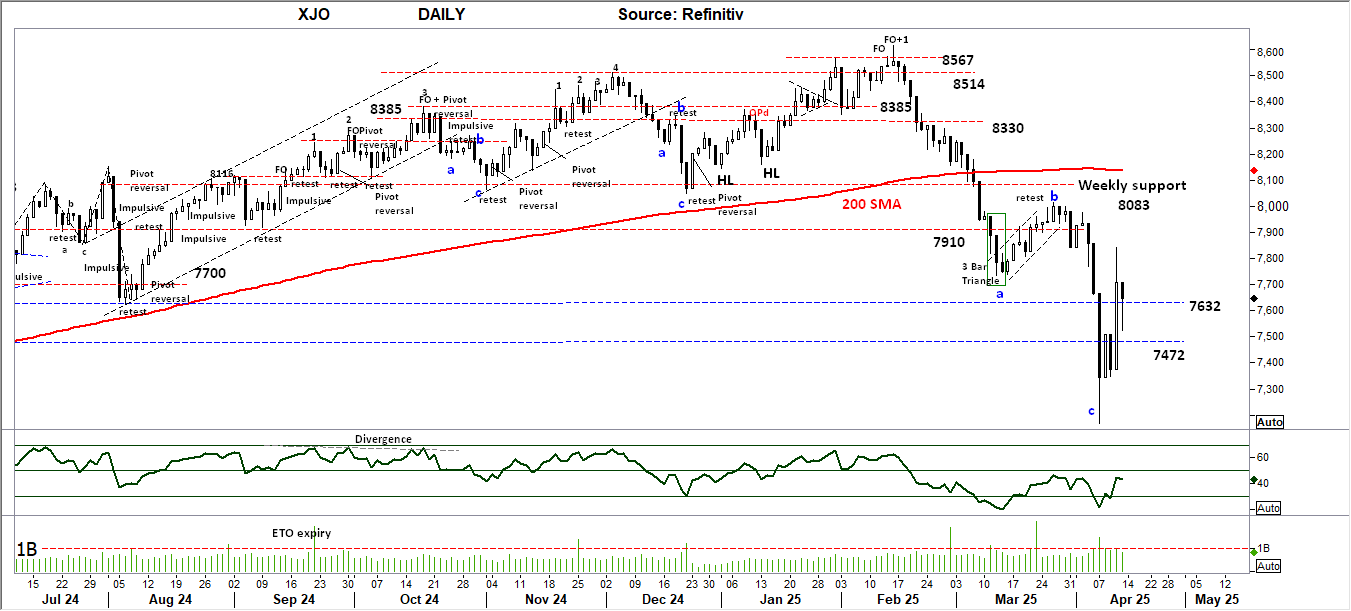
XJO DAILY
Price structure: Pivot reversal
The a-b-c pattern has been a central theme in recent discussions, this has now reached its full resolution, as the Index extended its movement, testing the 7,200 level. This development marks the culmination of the anticipated corrective phase, reinforcing the structured nature of the pattern. With this test complete, attention now shifts to whether the market stabilizes at this threshold or signals the next directional move. The Daily closing over 7632-point level is a strong bullish signal with continuation higher expected. The current volume study has trading volumes below the 1B level, this is not strong volume showing a lack of interest from sidelined investors, momentum may slow or weaken with a grind higher.
Indicator: Relative strength 14: Bearish
The Relative strength Indicator (14) remains below the important 50 levels after the initial fall below the 30 level, the overall RSI trend shows downside momentum associated with the current breakdown from the small trading ranges within the Bear flag. A move lower, further below the 30 level could be expected. From a technical perspective, RSI dropping below 30 often suggests an oversold condition, but in the context of overall bearish momentum, it can also indicate that selling pressure remains dominant.
Comments last week:- The potential a,b,c pattern highlighted in the past 2 weeks, is now confirmed with the Index closing below the “a” point low, the “c” wave is now underway. The Index has moved lower through the key 7910 level to target the 7632 support level. The potential for a further 5% decline to reach the projected target range of 7340 -7400 points remains. The XJO has now entered into a Primary down trend. The XJO index is in a Bear market confirmed by a Primary down trend in the Materials and Financial indices along with Emerging market Index.
XJO DAILY
Price structure: Pivot reversal
The a-b-c pattern has been a central theme in recent discussions, this has now reached its full resolution, as the Index extended its movement, testing the 7,200 level. This development marks the culmination of the anticipated corrective phase, reinforcing the structured nature of the pattern. With this test complete, attention now shifts to whether the market stabilizes at this threshold or signals the next directional move. The Daily closing over 7632-point level is a strong bullish signal with continuation higher expected. The current volume study has trading volumes below the 1B level, this is not strong volume showing a lack of interest from sidelined investors, momentum may slow or weaken with a grind higher.
Indicator: Relative strength 14: Bearish
The Relative strength Indicator (14) remains below the important 50 levels after the initial fall below the 30 level, the overall RSI trend shows downside momentum associated with the current breakdown from the small trading ranges within the Bear flag. A move lower, further below the 30 level could be expected. From a technical perspective, RSI dropping below 30 often suggests an oversold condition, but in the context of overall bearish momentum, it can also indicate that selling pressure remains dominant.
 Comments last week: The Bear Flag structure, previously discussed, has officially broken downward, reinforcing the broader bearish sentiment. With key Daily support levels at 7632 and 7472, these zones now play a crucial role in defining the next potential move.
Last Friday’s expanded trading range suggests strong momentum, with a significant possibility of follow-through selling. From a technical perspective, the price action closing near its lows indicates heavy downside pressure, particularly when paired with the volume study.
The increasing volume observed late last week further confirms active selling interest, indicating that sellers are firmly in control. When bearish price action is backed by growing volume, it often suggests strong conviction behind the move, making any attempts at recovery likely to face resistance.
At this stage, traders may closely monitor whether support levels hold or break down further, as sustained volume pressure could pave the way for an extended downside continuation.
S&P 500 WEEKLY: Haguro resistance level
With a solid test at the 5120 level followed by the retest of the Trendline at 4835 points.
The Haguro method considers the Midpoint of a large range bar as support or resistance. Currently the S&P has closed at the 5382 mid point of the range from 2 weeks ago. With current market volatility longer term traders should look for a further close higher to confirm the current price recovery. The price action last week, a result from a significant short cover rally may result in further consolidation below the 5,500 level.
Indicator: Relative strength 14.
The recent movement lower is highlighting fading price momentum within the consolidation zone, suggesting that bullish strength remains absent for now.
For bullish confirmation, a recovery back toward the 50 level on the RSI is necessary. This would indicate renewed strength and the potential for an upside shift in momentum.
The current RSI reading moving above 30 without a cross of the 50 level further reinforces bearish pressure, confirming a continued loss of momentum.
A deeper move into oversold territory could signal potential exhaustion among sellers, but without clear evidence of buyers stepping in, downside risks remain elevated.
Comments last week: The Bear Flag structure, previously discussed, has officially broken downward, reinforcing the broader bearish sentiment. With key Daily support levels at 7632 and 7472, these zones now play a crucial role in defining the next potential move.
Last Friday’s expanded trading range suggests strong momentum, with a significant possibility of follow-through selling. From a technical perspective, the price action closing near its lows indicates heavy downside pressure, particularly when paired with the volume study.
The increasing volume observed late last week further confirms active selling interest, indicating that sellers are firmly in control. When bearish price action is backed by growing volume, it often suggests strong conviction behind the move, making any attempts at recovery likely to face resistance.
At this stage, traders may closely monitor whether support levels hold or break down further, as sustained volume pressure could pave the way for an extended downside continuation.
S&P 500 WEEKLY: Haguro resistance level
With a solid test at the 5120 level followed by the retest of the Trendline at 4835 points.
The Haguro method considers the Midpoint of a large range bar as support or resistance. Currently the S&P has closed at the 5382 mid point of the range from 2 weeks ago. With current market volatility longer term traders should look for a further close higher to confirm the current price recovery. The price action last week, a result from a significant short cover rally may result in further consolidation below the 5,500 level.
Indicator: Relative strength 14.
The recent movement lower is highlighting fading price momentum within the consolidation zone, suggesting that bullish strength remains absent for now.
For bullish confirmation, a recovery back toward the 50 level on the RSI is necessary. This would indicate renewed strength and the potential for an upside shift in momentum.
The current RSI reading moving above 30 without a cross of the 50 level further reinforces bearish pressure, confirming a continued loss of momentum.
A deeper move into oversold territory could signal potential exhaustion among sellers, but without clear evidence of buyers stepping in, downside risks remain elevated.
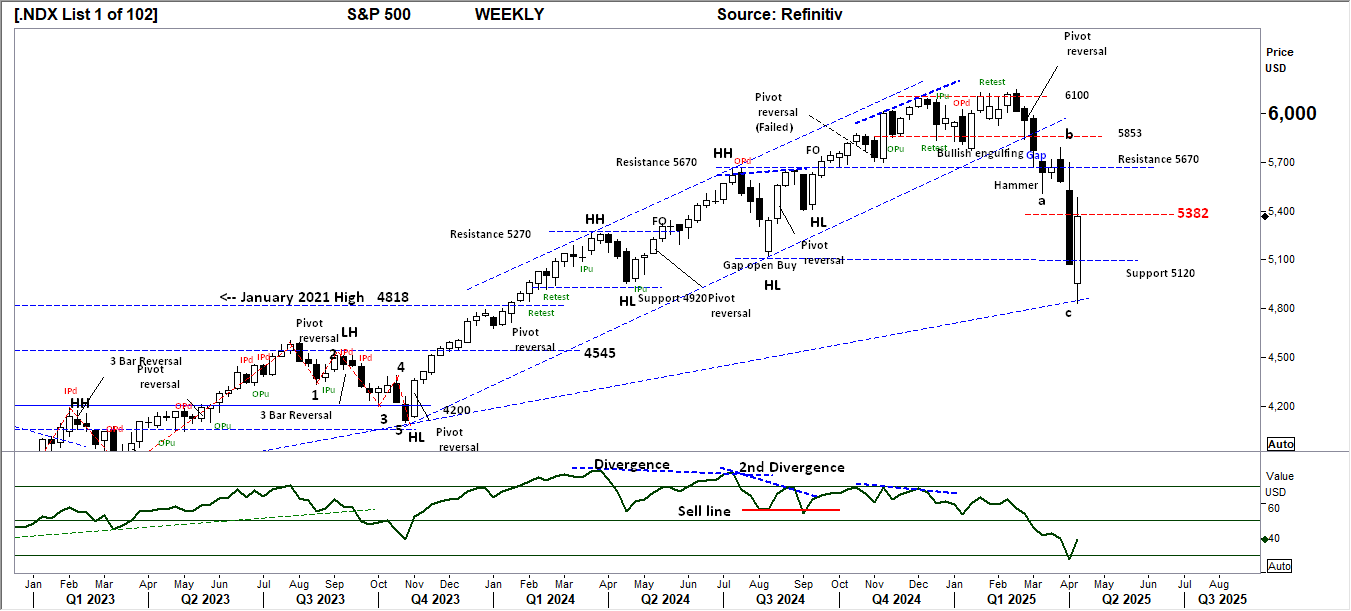 Comments from last week.: The a,b,c corrective pattern has now fully confirmed as price action breaks below the ‘a’ point low, reinforcing the bearish structure. This development signals that the pattern has completed its expected downside move, increasing the probability of further decline unless a strong reversal emerges.
At present, the Index is testing the 5120-support level, a critical area that could determine whether the downward momentum persists. If price fails to hold above 5120, the breakdown may accelerate, leading to further losses. However, if buying interest emerges at this level, it could signal a potential reactionary bounce or consolidation.
SPX DAILY Price structure: Pivot reversal
April 2024 support level at 4953 has again provided support for a reversal pattern from the recent sharp decline. The large range Pivot reversal, the result from a strong short cover event has not followed through higher from the 5504-resistance level. Further consolidation could be expected at this Gap level prior to a move higher.
Overall momentum observed by the RSI continues to decline.
Indicator: Relative strength 14.
The Relative Strength Indicator (RSI) has moved below the key 30 level turning lower in line with price action of 2 weeks ago, momentum has now turned towards a Bullish reversal although not complete until a cross of the key 50 level. A close above the 50 level is required to remain bullish. If the RSI falls further below the pivotal 30 level, it will likely confirm a further bearish outlook, leading to further downside targets.
Comments from last week.: The a,b,c corrective pattern has now fully confirmed as price action breaks below the ‘a’ point low, reinforcing the bearish structure. This development signals that the pattern has completed its expected downside move, increasing the probability of further decline unless a strong reversal emerges.
At present, the Index is testing the 5120-support level, a critical area that could determine whether the downward momentum persists. If price fails to hold above 5120, the breakdown may accelerate, leading to further losses. However, if buying interest emerges at this level, it could signal a potential reactionary bounce or consolidation.
SPX DAILY Price structure: Pivot reversal
April 2024 support level at 4953 has again provided support for a reversal pattern from the recent sharp decline. The large range Pivot reversal, the result from a strong short cover event has not followed through higher from the 5504-resistance level. Further consolidation could be expected at this Gap level prior to a move higher.
Overall momentum observed by the RSI continues to decline.
Indicator: Relative strength 14.
The Relative Strength Indicator (RSI) has moved below the key 30 level turning lower in line with price action of 2 weeks ago, momentum has now turned towards a Bullish reversal although not complete until a cross of the key 50 level. A close above the 50 level is required to remain bullish. If the RSI falls further below the pivotal 30 level, it will likely confirm a further bearish outlook, leading to further downside targets.
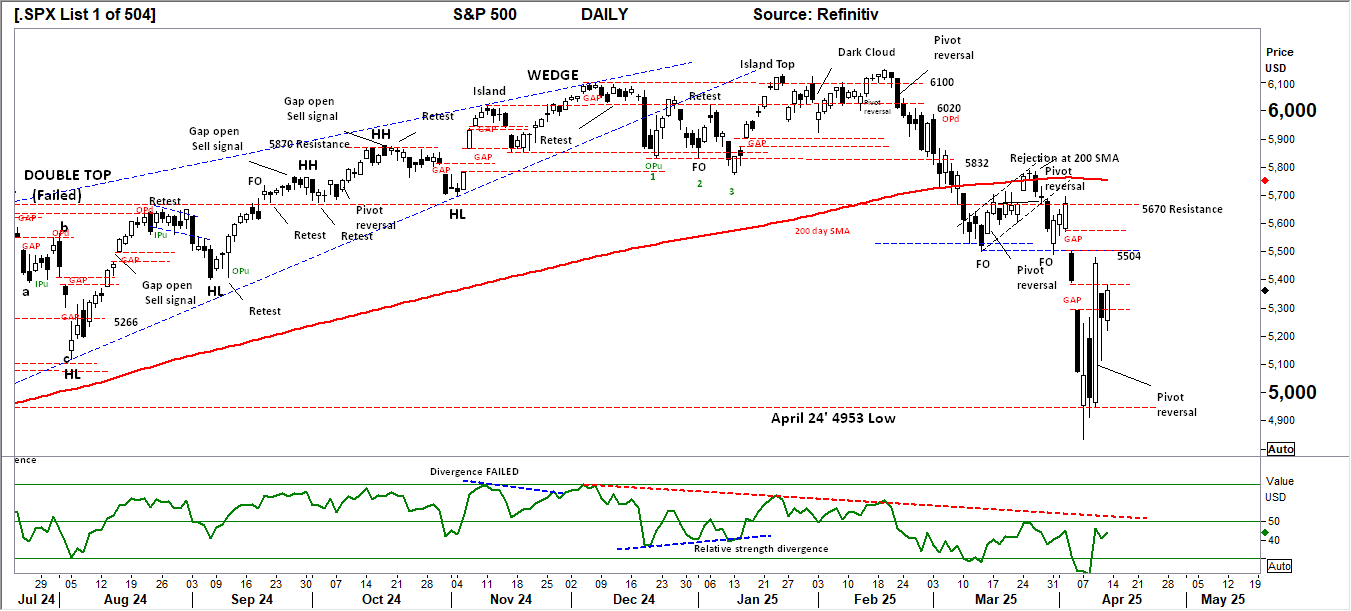 Comments from last week: The Daily chart unmistakably highlights a significant panic-driven sell-off, which is evident from the pronounced gapping in price action. This illustrates a strong reaction likely driven by fear or uncertainty among market participants. Moreover, the expanded range observed last Friday further reinforces the dominance of sellers, showcasing their firm grip over the market during this period. The combination of these factors suggests intense selling pressure and heightened market volatility. Next key support level 4818 points.
NASDAQ (100) DAILY Price structure: Consolidation.
This week, traders will keep a sharp focus on the 19,180 resistance level, as it marks a pivotal point in market activity. The notable and robust range established last Wednesday has not demonstrated continued momentum to the upside as the trading week drew to a close. Instead, the final sessions of the week have been characterized by the formation of two inside range bars, signalling indecision and hinting at the potential for a consolidation phase to develop. Should the Index advance from this current close over the 19,180 level considerable resistance remains at the 200 day moving average now rolling over lower.
Indicator: Relative strength 14: Bearish turn
The Relative Strength Index (RSI) has now shifted downward, breaking towards the critical 50 level, which signals increasing strength in momentum. Should the RSI continue to fall further below the 30 level, it would serve as a strongly Bearish indicator, highlighting a significant warning of potential further downside that market participants cannot afford to overlook.
Comments from last week: The Daily chart unmistakably highlights a significant panic-driven sell-off, which is evident from the pronounced gapping in price action. This illustrates a strong reaction likely driven by fear or uncertainty among market participants. Moreover, the expanded range observed last Friday further reinforces the dominance of sellers, showcasing their firm grip over the market during this period. The combination of these factors suggests intense selling pressure and heightened market volatility. Next key support level 4818 points.
NASDAQ (100) DAILY Price structure: Consolidation.
This week, traders will keep a sharp focus on the 19,180 resistance level, as it marks a pivotal point in market activity. The notable and robust range established last Wednesday has not demonstrated continued momentum to the upside as the trading week drew to a close. Instead, the final sessions of the week have been characterized by the formation of two inside range bars, signalling indecision and hinting at the potential for a consolidation phase to develop. Should the Index advance from this current close over the 19,180 level considerable resistance remains at the 200 day moving average now rolling over lower.
Indicator: Relative strength 14: Bearish turn
The Relative Strength Index (RSI) has now shifted downward, breaking towards the critical 50 level, which signals increasing strength in momentum. Should the RSI continue to fall further below the 30 level, it would serve as a strongly Bearish indicator, highlighting a significant warning of potential further downside that market participants cannot afford to overlook.
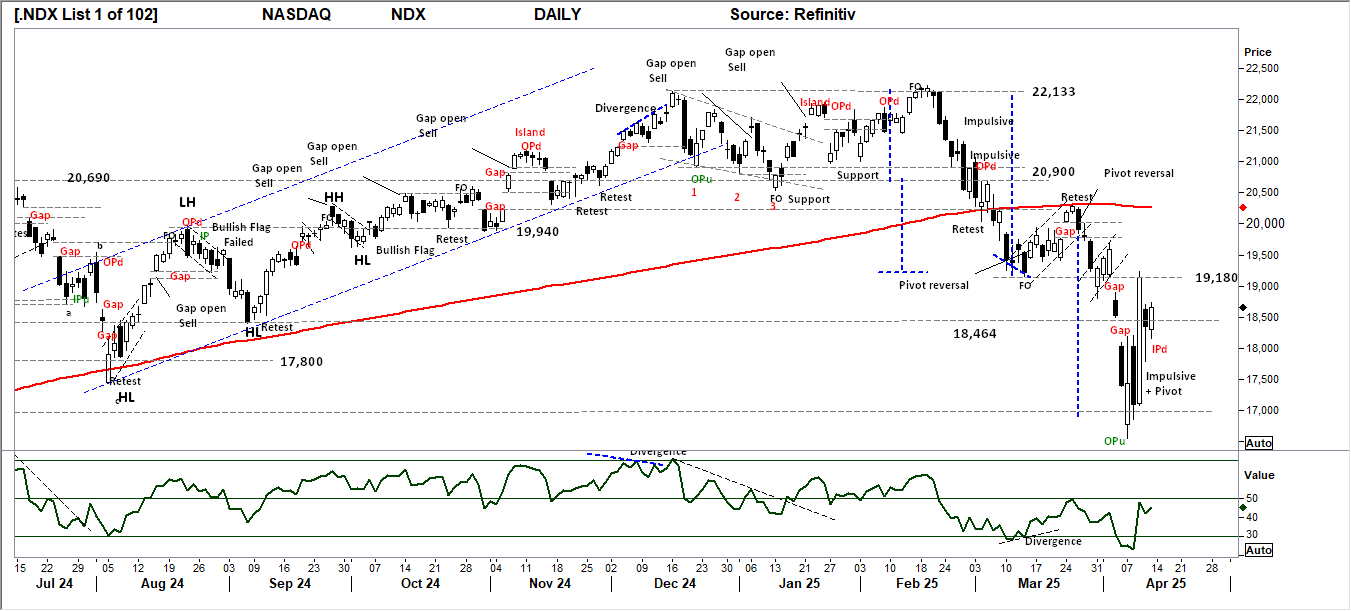 Comments from last week. The Nasdaq has officially transitioned into a Primary downtrend, marked by a significant shift in price movement. This development is underscored by the index falling below the critical low point of 19,180 recorded in March and the 18,464 low point set in September 2024. Such a breach signals strong bearish sentiment among market participants, potentially indicating further downward pressure and a challenging period ahead for the index.
USD Spot GOLD – DAILY: Momentum high
Gold remains with a strong Primary UP trend.
The successful retest of the $2956.0 level last week has set an impulsive price movement with follow through higher over the prior $3167.50 high. As the past 5 bars have set a low below 2 weeks ago and a new high the Weekly chart shows an outside range, this can be highly indicative of a short term top approaching. Until a reversal pattern shows the current projection is for a higher price within this Primary UP Trend.
Indicator: Relative Strength 14:
The RSI has moved to cross the 70 level but remains lower than the previous high point. This is a signal of weakening momentum in this current look back period (14), however, it remains a short-term observation price remains in strong upward momentum. Further RSI declines in the coming week below the 70 level will reflect the potential for a strong divergence top to develop. Short term holders and traders should now monitor the RSI for a cross below the 50 level as a sell signal.
Comments from last week. The Nasdaq has officially transitioned into a Primary downtrend, marked by a significant shift in price movement. This development is underscored by the index falling below the critical low point of 19,180 recorded in March and the 18,464 low point set in September 2024. Such a breach signals strong bearish sentiment among market participants, potentially indicating further downward pressure and a challenging period ahead for the index.
USD Spot GOLD – DAILY: Momentum high
Gold remains with a strong Primary UP trend.
The successful retest of the $2956.0 level last week has set an impulsive price movement with follow through higher over the prior $3167.50 high. As the past 5 bars have set a low below 2 weeks ago and a new high the Weekly chart shows an outside range, this can be highly indicative of a short term top approaching. Until a reversal pattern shows the current projection is for a higher price within this Primary UP Trend.
Indicator: Relative Strength 14:
The RSI has moved to cross the 70 level but remains lower than the previous high point. This is a signal of weakening momentum in this current look back period (14), however, it remains a short-term observation price remains in strong upward momentum. Further RSI declines in the coming week below the 70 level will reflect the potential for a strong divergence top to develop. Short term holders and traders should now monitor the RSI for a cross below the 50 level as a sell signal.
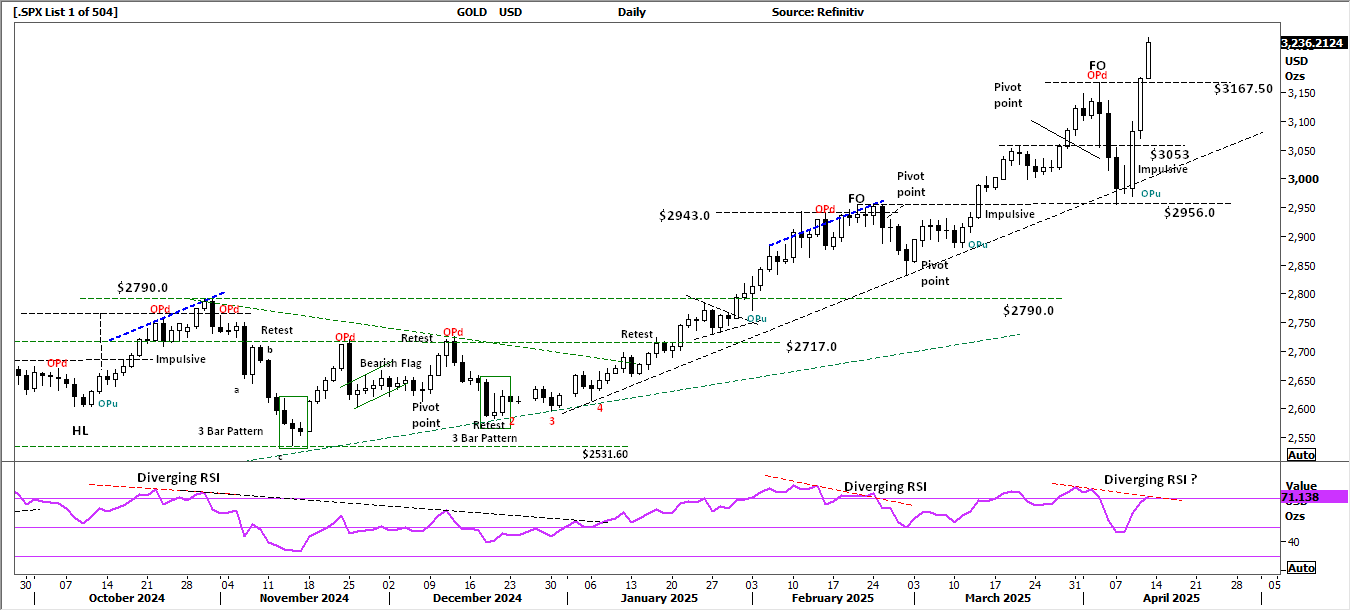 Comments from last week: The market is exhibiting considerable price volatility, as highlighted by the Outside range (Opd) established last Thursday. This pattern serves as a clear indicator of significant fluctuations in trading activity from the Buyers and Sellers. The subsequent decline in prices can be attributed to short-term profit-taking by investors, reflecting a temporary pullback after recent gains. The pattern now sets a pivot point reversal signal. The 3053 level has not provided price support with $2956 remaining as the lower target support level to hold.
AUD GOLD – DAILY: Bullish range
With $USD Gold surging higher and the $AUD remaining stable around the $0.62-63c level the Australian dollar Gold price continues to move high in this exponential Trend. This type of exponential price move can lead to a sharp reversal as profit taking takes place in the underlying USD Gold price or a strong move higher in the $AUD. Australian Gold producers will continue to benefit from this price action.
Indicator: Relative Strength 14:
The Relative Strength Index (RSI) is showing a consistent move above the pivotal 50 level and 70 level. This persistence above the 70 topline suggests that the bullish momentum is not only intact but may strengthen. Traders are advised to watch for any minor pullbacks as potential buying opportunities within this broader uptrend, as the overall market sentiment remains strongly in favour of continued gains.
Comments from last week: The market is exhibiting considerable price volatility, as highlighted by the Outside range (Opd) established last Thursday. This pattern serves as a clear indicator of significant fluctuations in trading activity from the Buyers and Sellers. The subsequent decline in prices can be attributed to short-term profit-taking by investors, reflecting a temporary pullback after recent gains. The pattern now sets a pivot point reversal signal. The 3053 level has not provided price support with $2956 remaining as the lower target support level to hold.
AUD GOLD – DAILY: Bullish range
With $USD Gold surging higher and the $AUD remaining stable around the $0.62-63c level the Australian dollar Gold price continues to move high in this exponential Trend. This type of exponential price move can lead to a sharp reversal as profit taking takes place in the underlying USD Gold price or a strong move higher in the $AUD. Australian Gold producers will continue to benefit from this price action.
Indicator: Relative Strength 14:
The Relative Strength Index (RSI) is showing a consistent move above the pivotal 50 level and 70 level. This persistence above the 70 topline suggests that the bullish momentum is not only intact but may strengthen. Traders are advised to watch for any minor pullbacks as potential buying opportunities within this broader uptrend, as the overall market sentiment remains strongly in favour of continued gains.
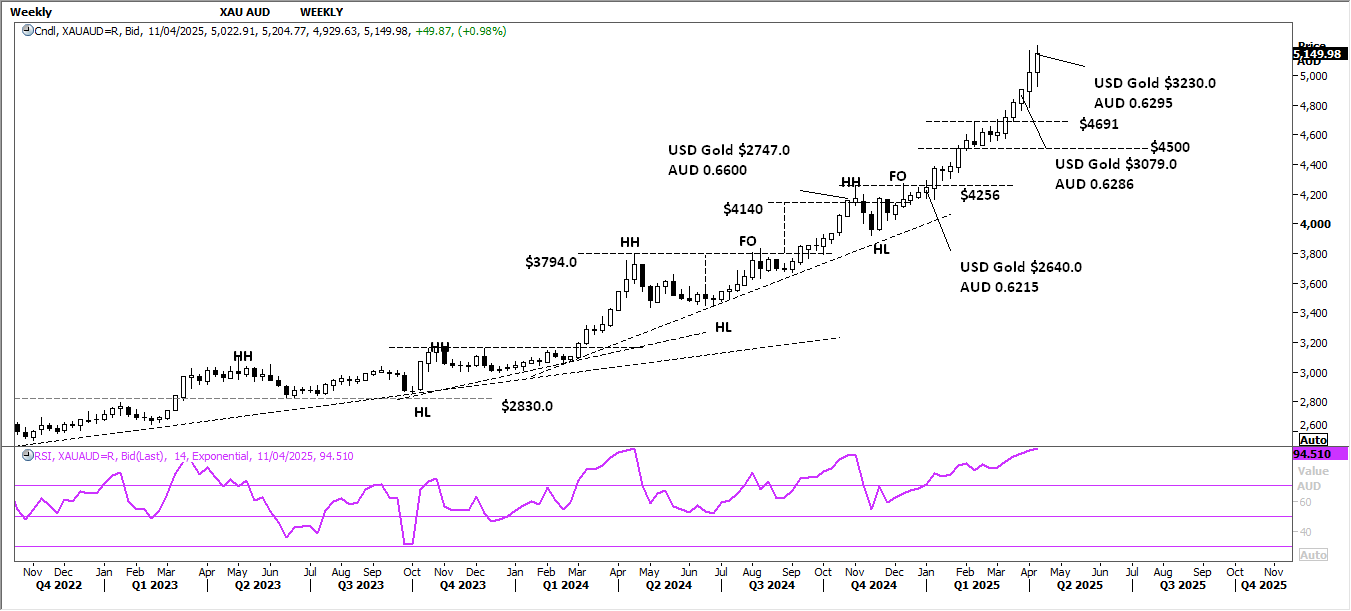 Comments from last week. From one week to the next USD Gold declines to $3030. The AUD Gold price has been supported by the significant decline in the $AUD currency. The expanded range at the top of a strong 18-month advance may indicate a top in the movement is near. This will reflect into the Australian Gold producers share price as early Sellers and profit takers may emerge.
SILVER Price structure: Rejection
Silver has again tested the lower channel in this ongoing range trade between Support at $28.50and resistance at $35.00. The 3 bar pattern set last week has also set a pivot reversal.
The resistance level at $32.50 remains a key level to cross in this current momentum move higher. Silver is not Gold.
Relative strength 14:
The relative strength index (RSI) has moved higher to align with the recent short-term reversal in price, from dipping below the critical 30 threshold, which typically signifies oversold conditions the current move higher has met the 50 level. This movement suggests a potential stabilization or recovery following the reversal. The Sell divergence signal that was highlighted in previous analyses over the past two weeks has now fully materialized, marking the expected decline.
Comments from last week. From one week to the next USD Gold declines to $3030. The AUD Gold price has been supported by the significant decline in the $AUD currency. The expanded range at the top of a strong 18-month advance may indicate a top in the movement is near. This will reflect into the Australian Gold producers share price as early Sellers and profit takers may emerge.
SILVER Price structure: Rejection
Silver has again tested the lower channel in this ongoing range trade between Support at $28.50and resistance at $35.00. The 3 bar pattern set last week has also set a pivot reversal.
The resistance level at $32.50 remains a key level to cross in this current momentum move higher. Silver is not Gold.
Relative strength 14:
The relative strength index (RSI) has moved higher to align with the recent short-term reversal in price, from dipping below the critical 30 threshold, which typically signifies oversold conditions the current move higher has met the 50 level. This movement suggests a potential stabilization or recovery following the reversal. The Sell divergence signal that was highlighted in previous analyses over the past two weeks has now fully materialized, marking the expected decline.
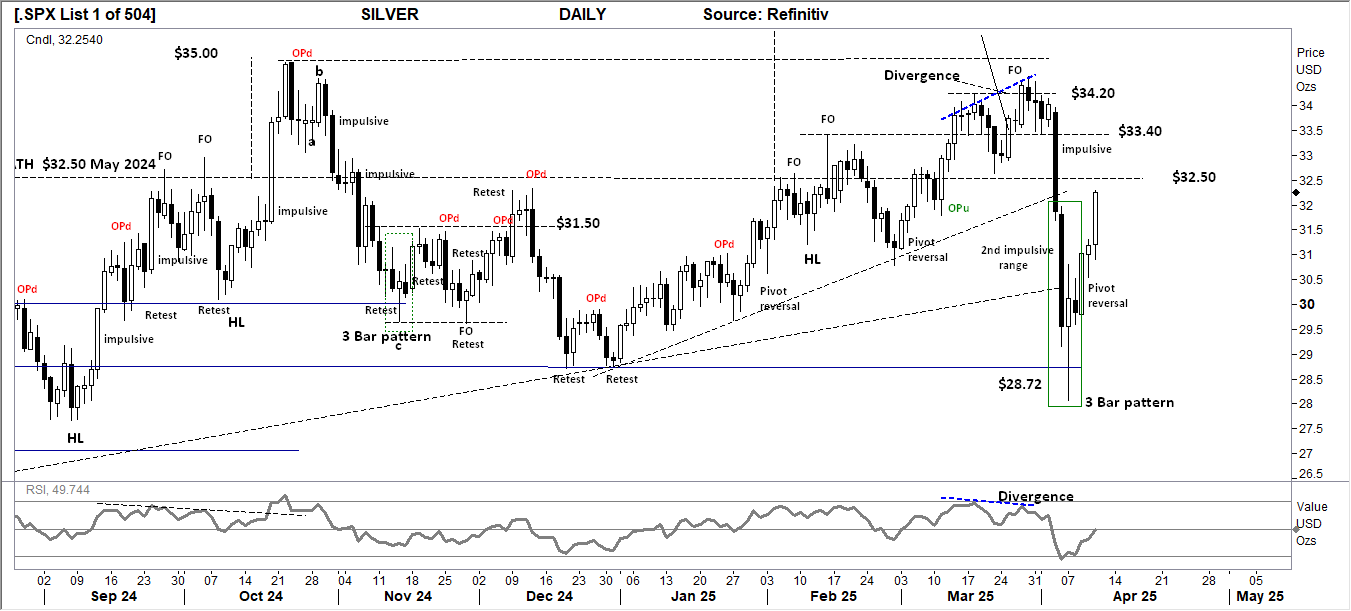 Comments from last week. Strong price rejection from the $34.20 level has Silver falling through key support levels towards the lower channel support of $28.72. Without a clear breakout, Silver remains with a long term price channel.
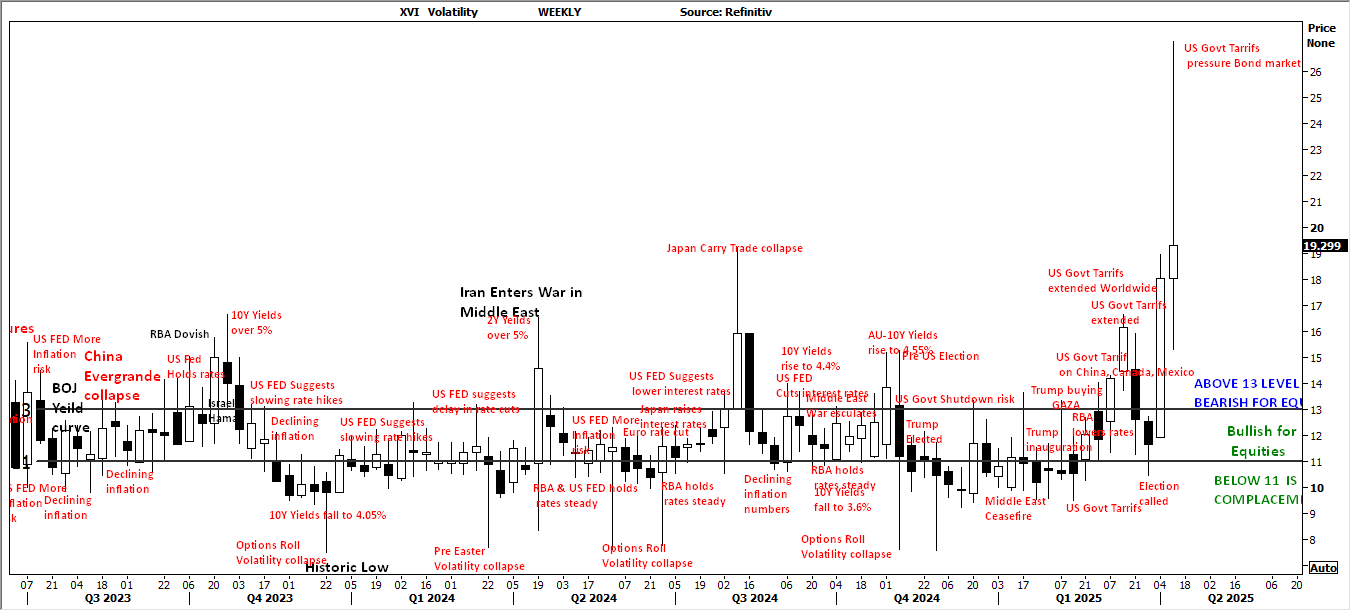
AUSTRALIAN VOLATILITY INDEX: The equities trader’s compass.
The current volatility closing value has closed above the key 13 level with a further spike higher during the week. Current closing value indicates the XVI volatility level has moved to an extreme Bearish level for Equities as the market VOLATILITY begins to see mid-week higher demand and subsequently higher priced PUT options to cover downside portfolio risk.
With the indicator value moving higher from the low Mid-week, the forward pricing (Volatility) of PUT options (insurance) is increasing, this is observed with a significant decline in the market. Volatility now rules in this current XJO200 corrective phase.
For continued support of equities, the XVI should remain subdued below the “13” level.
The cost of 3month forward PUT options is moving lower from recent higher levels over 13.
Comments from last week. Strong price rejection from the $34.20 level has Silver falling through key support levels towards the lower channel support of $28.72. Without a clear breakout, Silver remains with a long term price channel.
AUSTRALIAN VOLATILITY INDEX: The equities trader’s compass.
The current volatility closing value has closed above the key 13 level with a further spike higher during the week. Current closing value indicates the XVI volatility level has moved to an extreme Bearish level for Equities as the market VOLATILITY begins to see mid-week higher demand and subsequently higher priced PUT options to cover downside portfolio risk.
With the indicator value moving higher from the low Mid-week, the forward pricing (Volatility) of PUT options (insurance) is increasing, this is observed with a significant decline in the market. Volatility now rules in this current XJO200 corrective phase.
For continued support of equities, the XVI should remain subdued below the “13” level.
The cost of 3month forward PUT options is moving lower from recent higher levels over 13.
 The XVI is the difference between 3-month forward pricing of ETO Options against current month. As markets anticipate events, the forward priced option volatility changes, hence this longer dated forward price change, or “skew” in pricing is measured in this XVI. The XVI value works as an inverse corelation to the underlying market movements.
Publication date:
2025-04-14 14:08:52 (GMT)