What is Happening with BTC/USD?
 BTC/USD Up 50% This Year
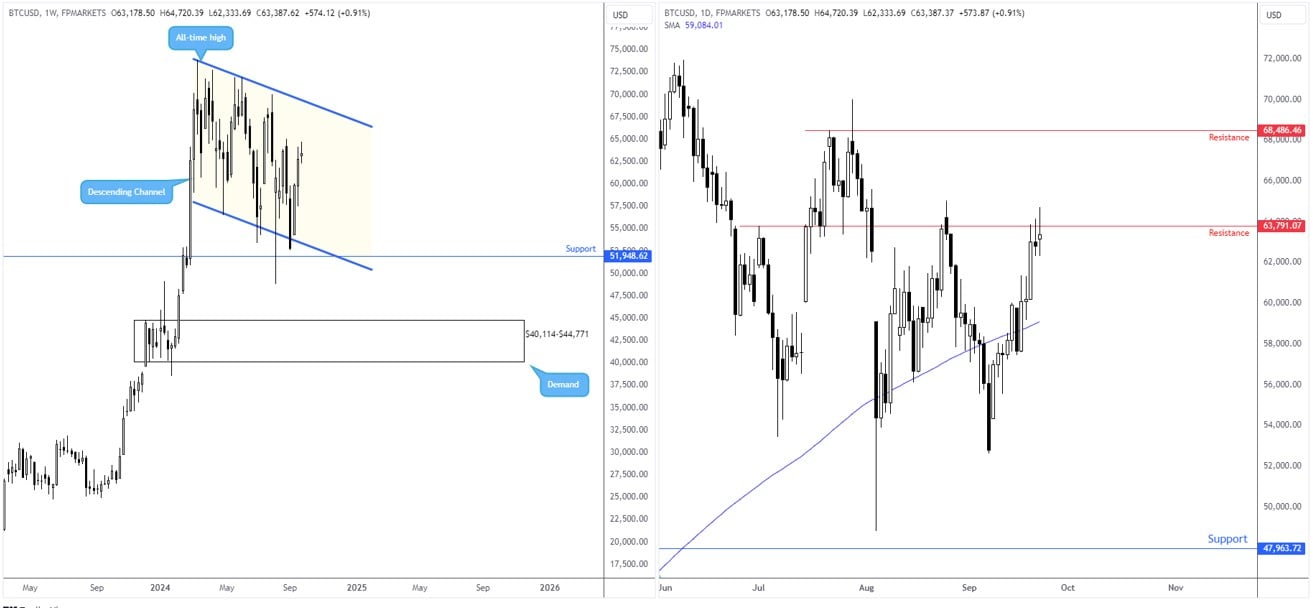
Bitcoin versus the US dollar (BTC/USD) has unquestionably been an outperformer. BTC/USD is up more than 50% year to date, and nearly 10% this month. However, we have to consider that the majority of the outperformance materialised in the first quarter of this year when the major crypto pairing hit an all-time high of US$73,845. Since then, buyers and sellers have been squaring off amid two descending limits between the said record peak and a low of US$56,478, commonly referred to as a descending channel among technical analysts.
The question is whether the descending channel is simply the pairing consolidating before printing another leg higher, or is it a sign of weakness that could eventually see the unit explore lower price levels.
Breakout Above Resistance?
Looking at the daily timeframe for a more magnified view, price action is seen testing resistance at US$63,791 and although sellers have made an appearance from the level, buyers remain strong. This follows a break above (and retest of) the 200-day simple moving average, currently circling around the US$59,085 region, which in itself is a bullish trend reversal signal.
Given the room to navigate higher on the weekly chart towards the upper boundary of the channel, a breakout above daily resistance should not raise too many eyebrows. Conservative traders attempting to trade any breakout higher will unlikely commit without a filter, such as a retest of the breached resistance to form support or even a ‘time’ filter (for example, the number of days price spends above the level).
BTC/USD Up 50% This Year
Bitcoin versus the US dollar (BTC/USD) has unquestionably been an outperformer. BTC/USD is up more than 50% year to date, and nearly 10% this month. However, we have to consider that the majority of the outperformance materialised in the first quarter of this year when the major crypto pairing hit an all-time high of US$73,845. Since then, buyers and sellers have been squaring off amid two descending limits between the said record peak and a low of US$56,478, commonly referred to as a descending channel among technical analysts.
The question is whether the descending channel is simply the pairing consolidating before printing another leg higher, or is it a sign of weakness that could eventually see the unit explore lower price levels.
Breakout Above Resistance?
Looking at the daily timeframe for a more magnified view, price action is seen testing resistance at US$63,791 and although sellers have made an appearance from the level, buyers remain strong. This follows a break above (and retest of) the 200-day simple moving average, currently circling around the US$59,085 region, which in itself is a bullish trend reversal signal.
Given the room to navigate higher on the weekly chart towards the upper boundary of the channel, a breakout above daily resistance should not raise too many eyebrows. Conservative traders attempting to trade any breakout higher will unlikely commit without a filter, such as a retest of the breached resistance to form support or even a ‘time’ filter (for example, the number of days price spends above the level).
Disclaimer:
The information contained in this material is intended for general advice only. It does not take into account your investment objectives, financial situation or particular needs. FP Markets has made every effort to ensure the accuracy of the information as at the date of publication. FP Markets does not give any warranty or representation as to the material. Examples included in this material are for illustrative purposes only. To the extent permitted by law, FP Markets and its employees shall not be liable for any loss or damage arising in any way (including by way of negligence) from or in connection with any information provided in or omitted from this material. Features of the FP Markets products including applicable fees and charges are outlined in the Product Disclosure Statements available from FP Markets website, www.fpmarkets.com and should be considered before deciding to deal in those products. Derivatives can be risky; losses can exceed your initial payment. FP Markets recommends that you seek independent advice. First Prudential Markets Pty Ltd trading as FP Markets ABN 16 112 600 281, Australian Financial Services License Number 286354.
Publication date:
2024-09-23 22:20:18 (GMT)