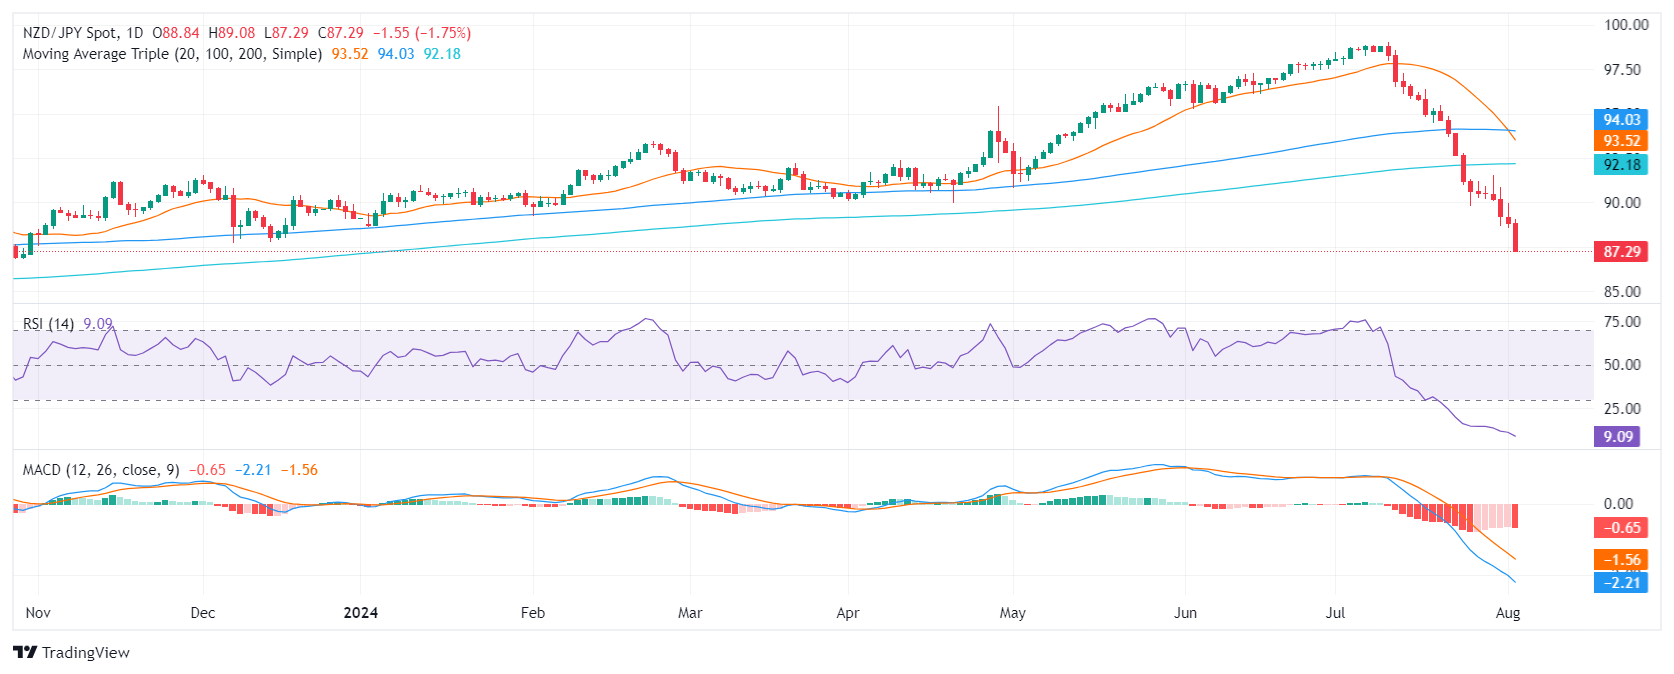
 Located below the 90.00 level, the pair is striving to hold a significant support level at 87.00, 86.50, and 86.00. Conversely, resistances are observed around 89.00, followed by more robust resistance around the 200-day SMA, potentially near 92.00.
NZD/JPY Price Analysis: Downward continuation, bulls fail to stop the bleeding
Located below the 90.00 level, the pair is striving to hold a significant support level at 87.00, 86.50, and 86.00. Conversely, resistances are observed around 89.00, followed by more robust resistance around the 200-day SMA, potentially near 92.00.Publication date:
2024-08-02 22:13:34 (GMT)
The terms and conditions of use set out below (referred to as "FX Blue's Terms"), form a contractual agreement governing FX Blue's relationship with you in relation to your use of this Website (“Agreement”) and you agree to be legally bound by FX Blue's Terms just as if you had signed this Agreement. By using this Website and any Information, you are agreeing to comply with and be bound by FX Blue's Terms, including any revisions that may be made to FX Blue's Terms from time to time. FX Blue reserves the right, in FX Blue's sole discretion, to change, modify, add or remove portions of FX Blue's Terms at any time by posting the revisions on the Website. You should check FX Blue's Terms periodically for changes as by using the Website after FX Blue posts any changes to FX Blue's Terms, you are agreeing to accept those changes, whether or not you have reviewed them, and you waive any right you may have to receive individualised notice of such changes. FX Blue's Terms may be supplemented by additional terms and conditions pertaining to specific content and activities. You agree and understand that such additional terms and conditions are hereby incorporated by reference to FX Blue's Terms. Your continued use of the Website means that you accept any new or modified FX Blue Terms.