NAGA Weekly Recap September 29 - October 3, 2025
By Naga
Get a complete weekly market recap: stocks, commodities, and forex moves, with the U.S. jobs report and Fed/ECB commentary driving investor sentiment.
Top Economic Events to Watch | September 29 - October 3, 2025
By Naga
Discover the top 3 economic events driving markets Sep 30–Oct 4, 2025. NFP, RBA rate decision, and ISM PMI—what traders need to know this week
Top Economic Events to Watch | September 22 - 26, 2025
By Naga
Stay ahead of the markets! Learn which economic reports—from US inflation to global PMIs—are set to move markets this week and why they matter.
NAGA Weekly Recap September 8 - 12, 2025
By Naga
Catch up on this week’s market action: tech-led stock rallies, oil rebounds, gold near highs, and FX shifts. See how geopolitical tensions and Fed moves impact traders.
NAGA Weekly Recap September 1 - 5, 2025
By Naga
Stay ahead of the markets with our weekly update: gold hits record highs, stocks react to rising yields, and the USD leads as traders navigate volatility and Fed signals.
NAGA Weekly Recap August 25 - 29, 2025
By Naga
Markets rebound as Fed pivot talk boosts equities, Bitcoin dips to $111K, and commodities & FX react to policy and geopolitical uncertainty.
NAGA Weekly Recap August 18 - 22, 2025
By Naga
Stay ahead of the markets as Powell takes the stage at Jackson Hole. Get the latest on equities, commodities, FX, and geopolitical risks shaping trading this week.
NAGA Weekly Recap August 11 - 15, 2025
By Naga
Weekly market recap: Tech-driven stock surge, volatile commodities, and a weakening dollar as traders weigh potential Fed rate cuts and global risks.
NAGA Weekly Recap August 4 - 8, 2025
By Naga
Stay ahead with this week’s financial recap: strong tech earnings, rising U.S. tariffs, volatile commodities, and shifting currency markets. Get the latest insights for savvy traders.
NAGA Weekly Recap July 21 - 25, 2025
By Naga
Markets wrapped the week digesting a wave of macro signals. The ECB kept rates on hold and doubled down on its data-dependent stance, signaling no rush to pivot. That echoed across risk assets, with traders recalibrating bets in real time.
NAGA Weekly Recap July 14 - 18, 2025
By Naga
Markets took a breather this week, moving mostly sideways as traders processed the latest economic data and waited for a stronger read on where global growth is headed. There’s still a mix of hope and caution out there—optimism about recovery, but inflation and sticky interest rates are keeping everyone on their toes.
NAGA Weekly Recap July 7 - 11, 2025
By Naga
Another week, another round of mixed signals. Inflation is still hanging around, but economic data hints at a slowdown. The result? Markets are stuck in a holding pattern—again.
NAGA Weekly Recap June 30 - July 4, 2025
By Naga
With the U.S. markets closing early Thursday and fully shut Friday for the July 4th holiday, this week was a slow grind. Volume was light, volatility was minimal, and most traders were in "wait-and-see" mode.
NAGA Weekly Recap June 23 - 27, 2025
By Naga
Global markets found some calm last week as Iran-Israel tensions cooled off, dialing down the geopolitical risk. With the heat dying down, traders turned their eyes to PMI data and end-of-month moves.
NAGA Weekly Recap June 16 - 20, 2025
By Naga
Choppy markets. Big moves. High stakes.
Geopolitical shockwaves hit this week as Israeli strikes on Iran spiked oil and gold prices. Equities flinched but held their ground — with the S&P 500 shaking off midweek jitters, thanks to strong U.S. data and tech’s relentless momentum.
NAGA Weekly Recap June 2 - 6, 2025
By Naga
Markets wrapped up the week on a tense note as traders digested a wave of key economic data, with the spotlight on the Non-Farm Payrolls (NFP) report. While signs of cooling inflation stirred some cautious optimism, uncertainty around central bank policy kept sentiment in check. Global indicators sent mixed signals—some sectors showed resilience, while others hinted at slowdown—leaving the outlook murky. Geopolitical tensions continued to simmer in the background, adding another layer of complexity for traders trying to gauge risk and momentum heading into next week.
NAGA Weekly Recap May 26 - 30, 2025
By Naga
Global markets closed the week in positive territory, supported by easing trade tensions and some encouraging signs of economic stability. While inflation and interest rate concerns haven’t disappeared, overall sentiment improved—especially in the U.S.—as investors responded to a more balanced macro picture.
NAGA Weekly Recap May 19 - 23, 2025
By Naga
Markets are looking heavy this week, with signs pointing to a potential breakdown. Gold pushed higher off key support, while the Yen gained strength. Silver is benefiting from Dollar weakness rather than real demand.
NAGA Weekly Recap May 12 - 16, 2025
By Naga
Markets wrapped up the week with a cautious but upbeat vibe. Traders saw a mix of signals — inflation worries stuck around, but so did signs of global stability. The result? A market mood that’s leaning more hopeful than fearful.
Top Economic Events to Watch | March 7 - 11, 2025
By Naga
This week, inflation takes center stage as major economies release fresh CPI data—key clues for where interest rates are headed next.
At the same time, markets are on edge after the US administration ramped up tariffs on key trading partners, fueling fresh uncertainty around global growth.
S&P 500 (SPX500) Showdown: Rebound Rally or Deeper Dive Ahead?
By Naga

 The S&P 500 index (SPX500) on the daily timeframe.
Past performance is not a reliable indicator of future results. All historical data, including but not limited to returns, volatility, and other performance metrics, should not be construed as a guarantee of future performance.
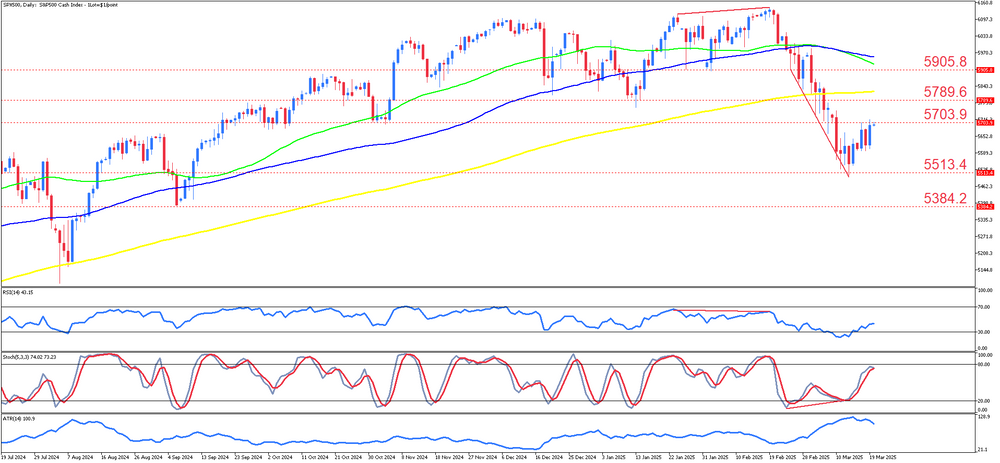
The S&P 500 index (SPX500) on the daily timeframe has recently experienced a significant downward correction after reaching record highs earlier in the year. Throughout the previous uptrend, the index demonstrated consistent strength, finding support on its 50-day (green) and 100-day (blue) moving averages, which acted as dynamic support levels during pullbacks. However, the failure to hold above these moving averages in early March 2025 led to an acceleration of bearish momentum. The decline pushed the index below key levels, confirming a technical breakdown, with the 200-day moving average (yellow) also failing to provide support during the initial selloff.
Following the sharp decline, the index established a local bottom near 5513.4, where buyers stepped in, leading to a short-term recovery. The rebound is currently testing the 5703.9 resistance level, which aligns closely with prior support now turned resistance. If the price can push higher, the next key resistance levels lie at 5789.6 and 5905.8, both of which coincide with significant technical levels. However, the presence of declining moving averages suggests that these zones could act as strong resistance. A failure to clear these levels could lead to renewed selling pressure, while a breakout above 5905.8 would signal potential bullish continuation.
Technical indicators reveal a mixed picture. The Relative Strength Index (RSI) at 43 indicates weak momentum but is not yet oversold, leaving room for further downside. The Stochastic Oscillator is rising from oversold conditions, indicating a short-term relief rally. However, a bullish divergence appears to be forming, as price action shows lower lows while the Stochastic Oscillator is making higher lows. This divergence suggests that downside momentum may be weakening, raising the possibility of another push higher. Historical analysis also reveals a bearish RSI divergence in late January 2025, where price made higher highs while RSI failed to confirm, leading to the current selloff.
In a bullish scenario, if the index sustains above 5703.9, it could extend the recovery toward 5789.6 and 5905.8. A confirmed breakout above these levels would indicate a shift in sentiment and increase the likelihood of a retest of the previous all-time highs near 6100. However, for this scenario to materialize, the price must also reclaim the 50-day and 100-day moving averages, turning them back into support. Without this confirmation, the rally remains vulnerable to failure.
Alternatively, if the index fails to hold above 5703.9, renewed selling pressure could send prices back toward 5513.4. A break below this support level would expose 5384.2, a zone that may attract stronger buyers. Given the clear bearish trend and recent failure of moving average bounces, further downside remains a strong possibility unless bulls can reclaim lost ground.
The S&P 500 is influenced by key macroeconomic and corporate factors, with both short- and long-term drivers shaping its outlook. The U.S. economy is projected to grow by 2.5% in 2025, indicating stable economic expansion. However, Federal Reserve policy remains a key variable, as interest rates significantly affect borrowing costs, corporate profits, and consumer spending. The Fed has recently opted to hold rates steady, citing ongoing economic uncertainty, but upcoming inflation and employment reports will be critical in shaping future rate decisions. While inflation has shown some cooling, persistent price pressures could force the Fed to keep rates higher for longer, weighing on equity markets.
Corporate earnings remain a major influence on the index, with Q1 2025 earnings projected to rise by 6.1% year-over-year on 3.7% revenue growth. However, downward revisions across most sectors indicate growing concerns over slowing demand and trade disruptions. The technology sector, which has driven much of the S&P 500’s gains, is now facing headwinds from regulatory scrutiny and slowing AI-related investments, creating additional uncertainty. Meanwhile, market sentiment remains cautious, as the index is down 3.5% year-to-date and recently confirmed entering a 10% correction from its February highs. Analysts have lowered year-end targets, with Goldman Sachs and RBC Capital Markets adjusting forecasts to 6,200, reflecting tempered optimism.
Upcoming macroeconomic events will be key in shaping market direction. The Federal Reserve’s next policy decision, alongside economic data on inflation and job growth, will play a major role in determining whether equities can stabilize or face further downside. Trade tensions between the U.S. and Europe are another emerging concern, as retaliatory tariffs from the European Commission could impact corporate earnings. Additionally, the Q1 earnings season will provide further insights into corporate health, with most sectors already seeing downward revisions in earnings estimates. Given these risks, investors should remain cautious and closely monitor upcoming data releases to gauge the market’s next move.
Summary:
- S&P 500 faces a correction after breaking key moving averages in March 2025.
- The index is testing resistance at 5703.9, with 5789.6 and 5905.8 as potential barriers.
- Mixed technical signals, with a bullish divergence but weak momentum.
- Macroeconomic factors like Fed policy and earnings will influence the next move.
The S&P 500 index (SPX500) on the daily timeframe.
Past performance is not a reliable indicator of future results. All historical data, including but not limited to returns, volatility, and other performance metrics, should not be construed as a guarantee of future performance.
The S&P 500 index (SPX500) on the daily timeframe has recently experienced a significant downward correction after reaching record highs earlier in the year. Throughout the previous uptrend, the index demonstrated consistent strength, finding support on its 50-day (green) and 100-day (blue) moving averages, which acted as dynamic support levels during pullbacks. However, the failure to hold above these moving averages in early March 2025 led to an acceleration of bearish momentum. The decline pushed the index below key levels, confirming a technical breakdown, with the 200-day moving average (yellow) also failing to provide support during the initial selloff.
Following the sharp decline, the index established a local bottom near 5513.4, where buyers stepped in, leading to a short-term recovery. The rebound is currently testing the 5703.9 resistance level, which aligns closely with prior support now turned resistance. If the price can push higher, the next key resistance levels lie at 5789.6 and 5905.8, both of which coincide with significant technical levels. However, the presence of declining moving averages suggests that these zones could act as strong resistance. A failure to clear these levels could lead to renewed selling pressure, while a breakout above 5905.8 would signal potential bullish continuation.
Technical indicators reveal a mixed picture. The Relative Strength Index (RSI) at 43 indicates weak momentum but is not yet oversold, leaving room for further downside. The Stochastic Oscillator is rising from oversold conditions, indicating a short-term relief rally. However, a bullish divergence appears to be forming, as price action shows lower lows while the Stochastic Oscillator is making higher lows. This divergence suggests that downside momentum may be weakening, raising the possibility of another push higher. Historical analysis also reveals a bearish RSI divergence in late January 2025, where price made higher highs while RSI failed to confirm, leading to the current selloff.
In a bullish scenario, if the index sustains above 5703.9, it could extend the recovery toward 5789.6 and 5905.8. A confirmed breakout above these levels would indicate a shift in sentiment and increase the likelihood of a retest of the previous all-time highs near 6100. However, for this scenario to materialize, the price must also reclaim the 50-day and 100-day moving averages, turning them back into support. Without this confirmation, the rally remains vulnerable to failure.
Alternatively, if the index fails to hold above 5703.9, renewed selling pressure could send prices back toward 5513.4. A break below this support level would expose 5384.2, a zone that may attract stronger buyers. Given the clear bearish trend and recent failure of moving average bounces, further downside remains a strong possibility unless bulls can reclaim lost ground.
The S&P 500 is influenced by key macroeconomic and corporate factors, with both short- and long-term drivers shaping its outlook. The U.S. economy is projected to grow by 2.5% in 2025, indicating stable economic expansion. However, Federal Reserve policy remains a key variable, as interest rates significantly affect borrowing costs, corporate profits, and consumer spending. The Fed has recently opted to hold rates steady, citing ongoing economic uncertainty, but upcoming inflation and employment reports will be critical in shaping future rate decisions. While inflation has shown some cooling, persistent price pressures could force the Fed to keep rates higher for longer, weighing on equity markets.
Corporate earnings remain a major influence on the index, with Q1 2025 earnings projected to rise by 6.1% year-over-year on 3.7% revenue growth. However, downward revisions across most sectors indicate growing concerns over slowing demand and trade disruptions. The technology sector, which has driven much of the S&P 500’s gains, is now facing headwinds from regulatory scrutiny and slowing AI-related investments, creating additional uncertainty. Meanwhile, market sentiment remains cautious, as the index is down 3.5% year-to-date and recently confirmed entering a 10% correction from its February highs. Analysts have lowered year-end targets, with Goldman Sachs and RBC Capital Markets adjusting forecasts to 6,200, reflecting tempered optimism.
Upcoming macroeconomic events will be key in shaping market direction. The Federal Reserve’s next policy decision, alongside economic data on inflation and job growth, will play a major role in determining whether equities can stabilize or face further downside. Trade tensions between the U.S. and Europe are another emerging concern, as retaliatory tariffs from the European Commission could impact corporate earnings. Additionally, the Q1 earnings season will provide further insights into corporate health, with most sectors already seeing downward revisions in earnings estimates. Given these risks, investors should remain cautious and closely monitor upcoming data releases to gauge the market’s next move.
Summary:
- S&P 500 faces a correction after breaking key moving averages in March 2025.
- The index is testing resistance at 5703.9, with 5789.6 and 5905.8 as potential barriers.
- Mixed technical signals, with a bullish divergence but weak momentum.
- Macroeconomic factors like Fed policy and earnings will influence the next move.NAGA Weekly Recap March 10 - 14, 2025
By Naga
This week, markets wrestled with uncertainty as stocks dropped early, rattled by U.S. tariff concerns, Fed policy speculation, and geopolitical risks. Brief optimism from economic data wasn’t enough to steady sentiment, keeping volatility high across asset classes. Traders remain on edge, waiting for clearer signals.
Forex Outlook: Is EUR/USD Gearing Up for Another Rally?
By Naga
Summary:
- EUR/USD is testing key support at 1.0450 within an ascending channel, with resistance near 1.0522.
- The price has bounced off the 100 and 200-period moving averages, indicating continued bullish momentum, but short-term volatility is rising.
- Technical indicators show mixed signals, with RSI at 47 and Stochastic rebounding from oversold levels, suggesting potential short-term bullishness.
- Fundamental factors, including ECB decisions and U.S. economic data, are influencing the pair’s movement, with key macro events ahead.
USD/JPY Struggles at Resistance – Next Big Move Unfolding?
By Naga

 Past performance is not indicative of future results. All historical data, including but not limited to returns, volatility, and other performance metrics, should not be construed as a guarantee of future performance.
USD/JPY on a 4-hour timeframe
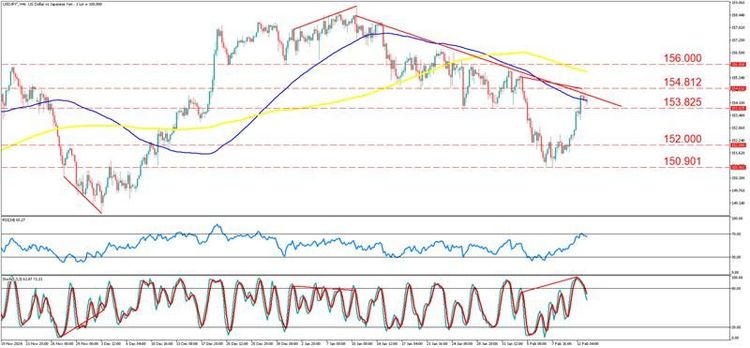
USD/JPY on a 4-hour timeframe has exhibited a series of technical developments, including multiple instances where the price found support at the 100-period simple moving average (SMA) in blue. Historically, the pair demonstrated an uptrend until late December before forming a bearish divergence on the RSI and Stochastic indicators, which coincided with a shift in market sentiment. This led to a downward correction, confirming a lower high formation and suggesting weakness in bullish momentum. Price eventually broke below the 100 SMA, reinforcing the selling pressure and initiating a deeper retracement.
In recent price action, USD/JPY has shown signs of recovery, bouncing from the 150.901 support level and approaching the 154.812 resistance. However, the recovery aligns with a descending trendline acting as dynamic resistance, suggesting a critical decision point. Notably, the price tested the 100 SMA multiple times before decisively breaking below it, and now it approaches the moving average from below, which may act as a resistance. The previous role of this SMA as support, followed by its recent breach, signals a potential shift in market structure.
The RSI currently hovers near 65, reflecting bullish momentum but not yet in overbought territory. Meanwhile, the Stochastic oscillator exhibits a hidden bearish divergence, where price made lower highs while the indicator formed higher highs, suggesting weakening bullish momentum. This divergence, combined with the confluence of resistance at the 100 SMA and descending trendline, raises the probability of a pullback or reversal from current levels.
The primary scenario anticipates that if the price fails to break above 154.812 and the 100 SMA with conviction, USD/JPY may resume its downtrend, targeting the 152.000 psychological level initially, followed by 150.901. A sustained break below these levels could open the door to further downside, potentially revisiting the 149.500 zone. Bearish confirmation may come from a rejection at resistance with increased selling pressure.
Alternatively, a break above 154.812 and the 100 SMA could invalidate the bearish outlook, allowing the price to test 156.000 and potentially beyond. If this breakout is supported by strong momentum and volume, it could signal the continuation of a bullish reversal, with buyers regaining control and pushing towards higher resistance levels.
Fundamentally, USD/JPY remains influenced by key macroeconomic factors, including interest rate differentials between the Federal Reserve and the Bank of Japan. With the Fed maintaining rates around 5.5% and the BoJ near 0%, the dollar remains more attractive, supporting USD/JPY. Upcoming events such as the U.S. CPI release on February 13, Fed Chair Powell’s testimony, U.S. retail sales data, Japanese GDP figures, and the BoJ policy decision will be critical. Higher-than-expected U.S. inflation could strengthen the dollar, while dovish Fed commentary may weaken it. Additionally, stronger Japanese GDP or any BoJ policy tightening signals could bolster the yen, introducing downside risks for USD/JPY. Traders should remain cautious and monitor these events for potential volatility.
Summary:
- Bearish Divergence Signals Weakness: RSI is near 65, and the Stochastic oscillator shows hidden bearish divergence, suggesting potential selling pressure.
- Key Resistance & SMA Test: USD/JPY broke below the 100 SMA, which is now acting as resistance near 154.812, aligning with a descending trendline.
- Critical Support Levels: If rejected at resistance, USD/JPY may drop towards 152.000, 150.901, or even 149.500 if bearish momentum strengthens.
- Breakout Scenario: A strong break above 154.812 and the 100 SMA could signal a bullish reversal, targeting 156.000 and beyond.
- Fundamental Risks: Upcoming U.S. CPI, Fed policy signals, BoJ decision, and Japan GDP data could drive volatility and influence USD/JPY’s next big move.
Past performance is not indicative of future results. All historical data, including but not limited to returns, volatility, and other performance metrics, should not be construed as a guarantee of future performance.
USD/JPY on a 4-hour timeframe
USD/JPY on a 4-hour timeframe has exhibited a series of technical developments, including multiple instances where the price found support at the 100-period simple moving average (SMA) in blue. Historically, the pair demonstrated an uptrend until late December before forming a bearish divergence on the RSI and Stochastic indicators, which coincided with a shift in market sentiment. This led to a downward correction, confirming a lower high formation and suggesting weakness in bullish momentum. Price eventually broke below the 100 SMA, reinforcing the selling pressure and initiating a deeper retracement.
In recent price action, USD/JPY has shown signs of recovery, bouncing from the 150.901 support level and approaching the 154.812 resistance. However, the recovery aligns with a descending trendline acting as dynamic resistance, suggesting a critical decision point. Notably, the price tested the 100 SMA multiple times before decisively breaking below it, and now it approaches the moving average from below, which may act as a resistance. The previous role of this SMA as support, followed by its recent breach, signals a potential shift in market structure.
The RSI currently hovers near 65, reflecting bullish momentum but not yet in overbought territory. Meanwhile, the Stochastic oscillator exhibits a hidden bearish divergence, where price made lower highs while the indicator formed higher highs, suggesting weakening bullish momentum. This divergence, combined with the confluence of resistance at the 100 SMA and descending trendline, raises the probability of a pullback or reversal from current levels.
The primary scenario anticipates that if the price fails to break above 154.812 and the 100 SMA with conviction, USD/JPY may resume its downtrend, targeting the 152.000 psychological level initially, followed by 150.901. A sustained break below these levels could open the door to further downside, potentially revisiting the 149.500 zone. Bearish confirmation may come from a rejection at resistance with increased selling pressure.
Alternatively, a break above 154.812 and the 100 SMA could invalidate the bearish outlook, allowing the price to test 156.000 and potentially beyond. If this breakout is supported by strong momentum and volume, it could signal the continuation of a bullish reversal, with buyers regaining control and pushing towards higher resistance levels.
Fundamentally, USD/JPY remains influenced by key macroeconomic factors, including interest rate differentials between the Federal Reserve and the Bank of Japan. With the Fed maintaining rates around 5.5% and the BoJ near 0%, the dollar remains more attractive, supporting USD/JPY. Upcoming events such as the U.S. CPI release on February 13, Fed Chair Powell’s testimony, U.S. retail sales data, Japanese GDP figures, and the BoJ policy decision will be critical. Higher-than-expected U.S. inflation could strengthen the dollar, while dovish Fed commentary may weaken it. Additionally, stronger Japanese GDP or any BoJ policy tightening signals could bolster the yen, introducing downside risks for USD/JPY. Traders should remain cautious and monitor these events for potential volatility.
Summary:
- Bearish Divergence Signals Weakness: RSI is near 65, and the Stochastic oscillator shows hidden bearish divergence, suggesting potential selling pressure.
- Key Resistance & SMA Test: USD/JPY broke below the 100 SMA, which is now acting as resistance near 154.812, aligning with a descending trendline.
- Critical Support Levels: If rejected at resistance, USD/JPY may drop towards 152.000, 150.901, or even 149.500 if bearish momentum strengthens.
- Breakout Scenario: A strong break above 154.812 and the 100 SMA could signal a bullish reversal, targeting 156.000 and beyond.
- Fundamental Risks: Upcoming U.S. CPI, Fed policy signals, BoJ decision, and Japan GDP data could drive volatility and influence USD/JPY’s next big move.
The terms and conditions of use set out below (referred to as "FX Blue's Terms"), form a contractual agreement governing FX Blue's relationship with you in relation to your use of this Website (“Agreement”) and you agree to be legally bound by FX Blue's Terms just as if you had signed this Agreement. By using this Website and any Information, you are agreeing to comply with and be bound by FX Blue's Terms, including any revisions that may be made to FX Blue's Terms from time to time. FX Blue reserves the right, in FX Blue's sole discretion, to change, modify, add or remove portions of FX Blue's Terms at any time by posting the revisions on the Website. You should check FX Blue's Terms periodically for changes as by using the Website after FX Blue posts any changes to FX Blue's Terms, you are agreeing to accept those changes, whether or not you have reviewed them, and you waive any right you may have to receive individualised notice of such changes. FX Blue's Terms may be supplemented by additional terms and conditions pertaining to specific content and activities. You agree and understand that such additional terms and conditions are hereby incorporated by reference to FX Blue's Terms. Your continued use of the Website means that you accept any new or modified FX Blue Terms.