The pattern pulse – 21 May 2025
 The FP Markets research team scans the financial markets for you, highlighting clear and actionable technical structures.
Forex: EUR/USD resistance calls for attention
Daily timeframe:
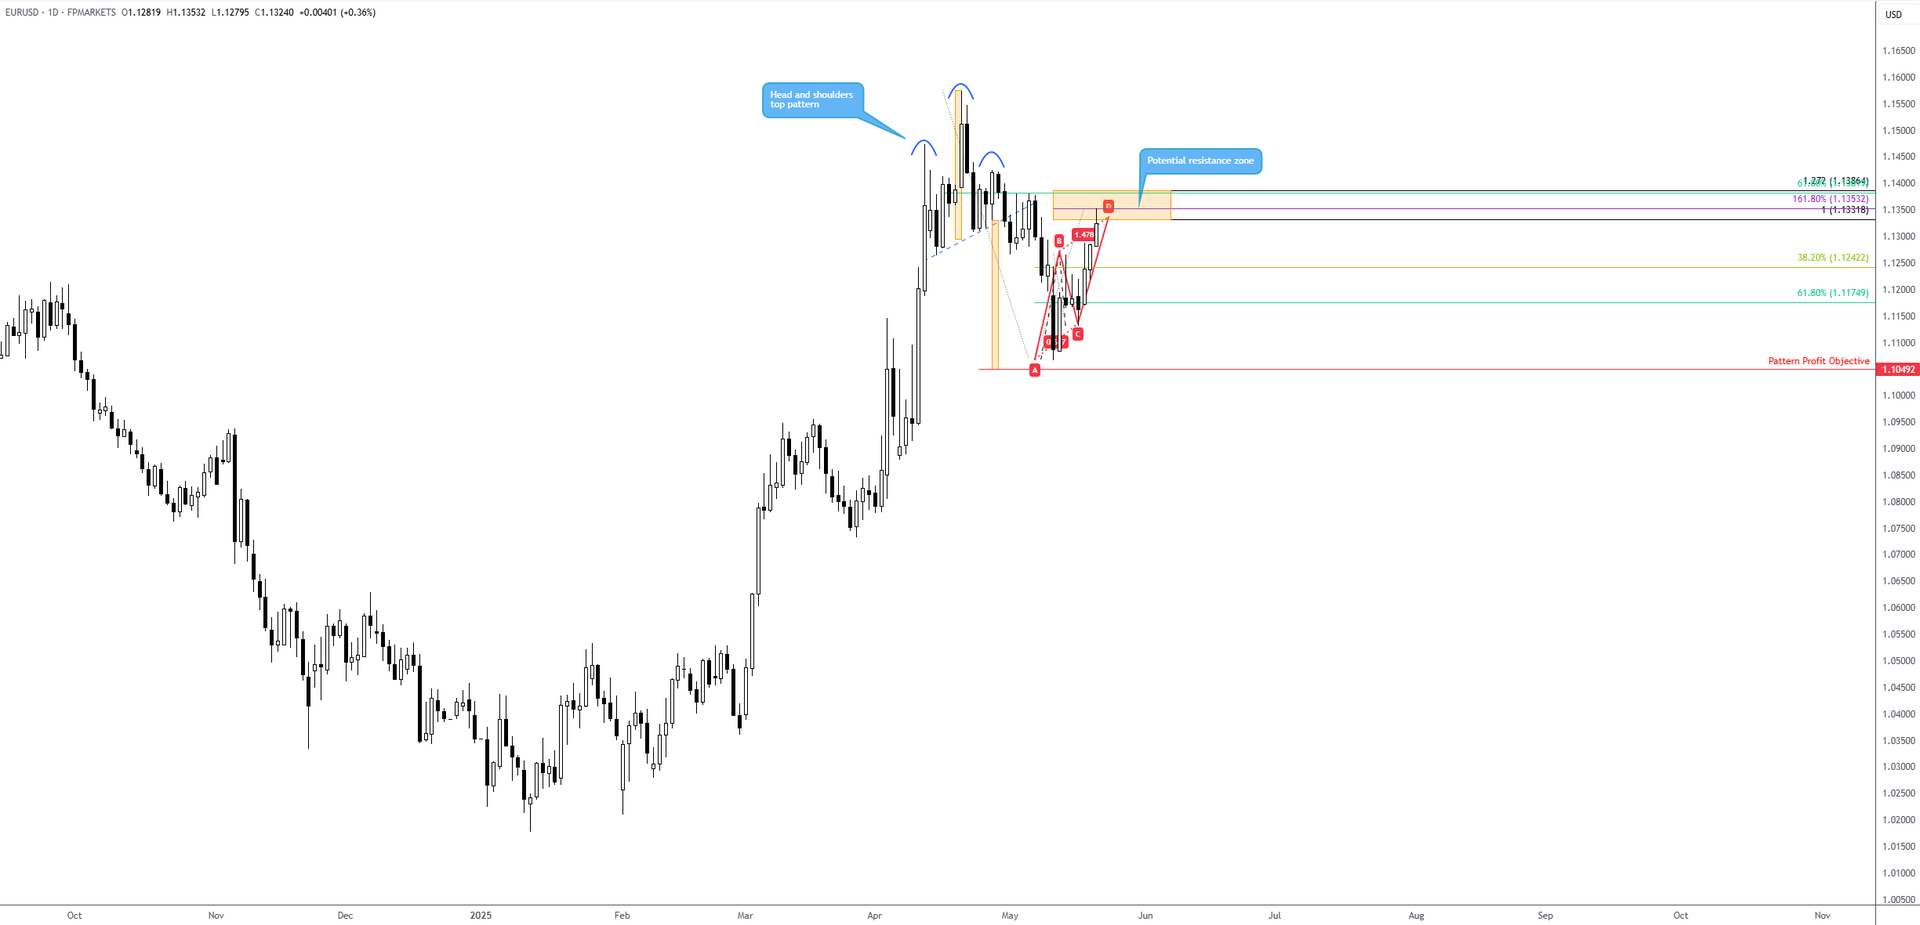
Following the EUR/USD (euro versus the US dollar) trading within striking distance of a head and shoulders top pattern’s profit objective at US$1.1049, bulls went on the offensive. Consequently, as shown on the chart below, price has pencilled in an AB=CD bearish formation at US$1.1332, according to the 100% projection ratio and a 1.618% Fibonacci extension ratio of US$1.1353 (B-C reciprocal). However, in terms of a resistance zone, I would be inclined to include the 1.272% Fibonacci projection ratio at US$1.1386, which shares chart space with a 61.8% Fibonacci retracement ratio from US$1.1382.
Harmonic traders tend to target the 38.2% and 61.8% Fibonacci retracement ratios derived from the A-D legs, which, assuming a temporary peak in price at current levels, reside at US$1.1242 and US$1.1175, respectively.
The FP Markets research team scans the financial markets for you, highlighting clear and actionable technical structures.
Forex: EUR/USD resistance calls for attention
Daily timeframe:
Following the EUR/USD (euro versus the US dollar) trading within striking distance of a head and shoulders top pattern’s profit objective at US$1.1049, bulls went on the offensive. Consequently, as shown on the chart below, price has pencilled in an AB=CD bearish formation at US$1.1332, according to the 100% projection ratio and a 1.618% Fibonacci extension ratio of US$1.1353 (B-C reciprocal). However, in terms of a resistance zone, I would be inclined to include the 1.272% Fibonacci projection ratio at US$1.1386, which shares chart space with a 61.8% Fibonacci retracement ratio from US$1.1382.
Harmonic traders tend to target the 38.2% and 61.8% Fibonacci retracement ratios derived from the A-D legs, which, assuming a temporary peak in price at current levels, reside at US$1.1242 and US$1.1175, respectively.
 Commodities: Clear support for Brent Crude
Monthly timeframe:
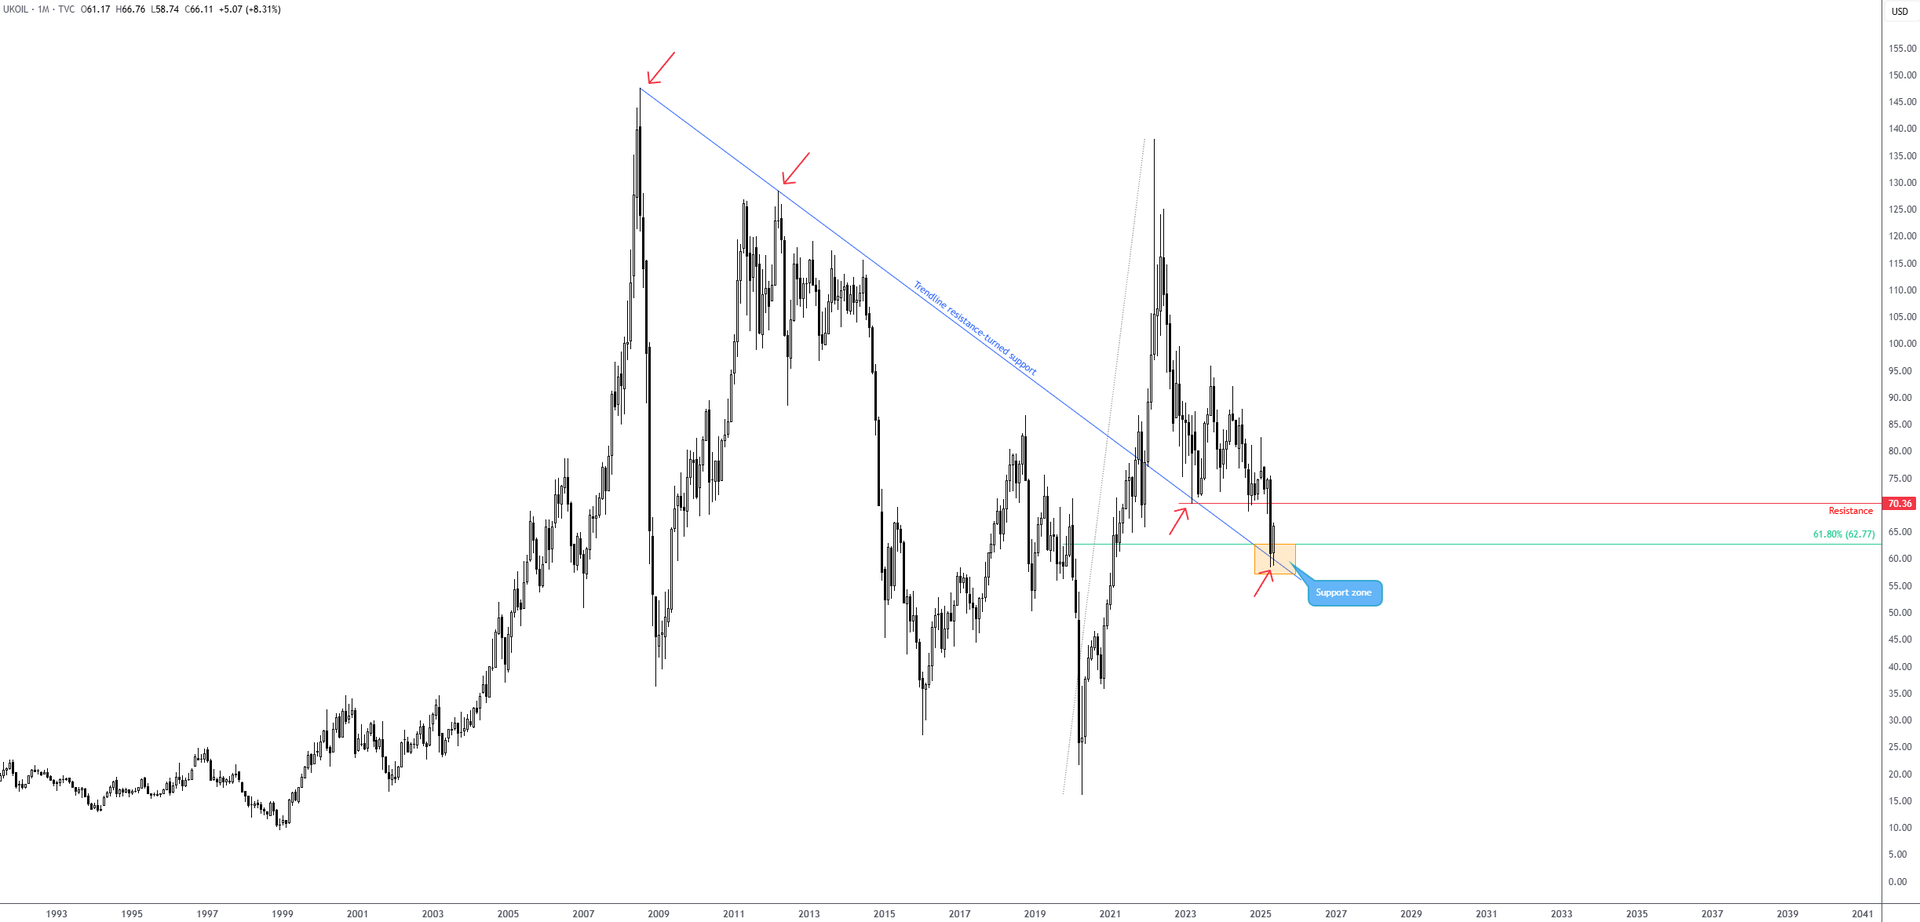
While Oil markets are bid on the back of recent reports of a potential Israel strike on Iran, long-term technical support is also in play on the monthly chart of Brent Crude (UKOIL). As shown below, trendline resistance-turned-support recently entered the fray around US$60.00, a descending line taken from the all-time high of US$147.50, and a 61.8% Fibonacci retracement ratio at US$62.77.
As a result, further buying may be seen towards monthly resistance coming in from US$70.36.
Commodities: Clear support for Brent Crude
Monthly timeframe:
While Oil markets are bid on the back of recent reports of a potential Israel strike on Iran, long-term technical support is also in play on the monthly chart of Brent Crude (UKOIL). As shown below, trendline resistance-turned-support recently entered the fray around US$60.00, a descending line taken from the all-time high of US$147.50, and a 61.8% Fibonacci retracement ratio at US$62.77.
As a result, further buying may be seen towards monthly resistance coming in from US$70.36.
 Equities: US equity indexes hovering north of 200-day SMAs
Daily timeframe:
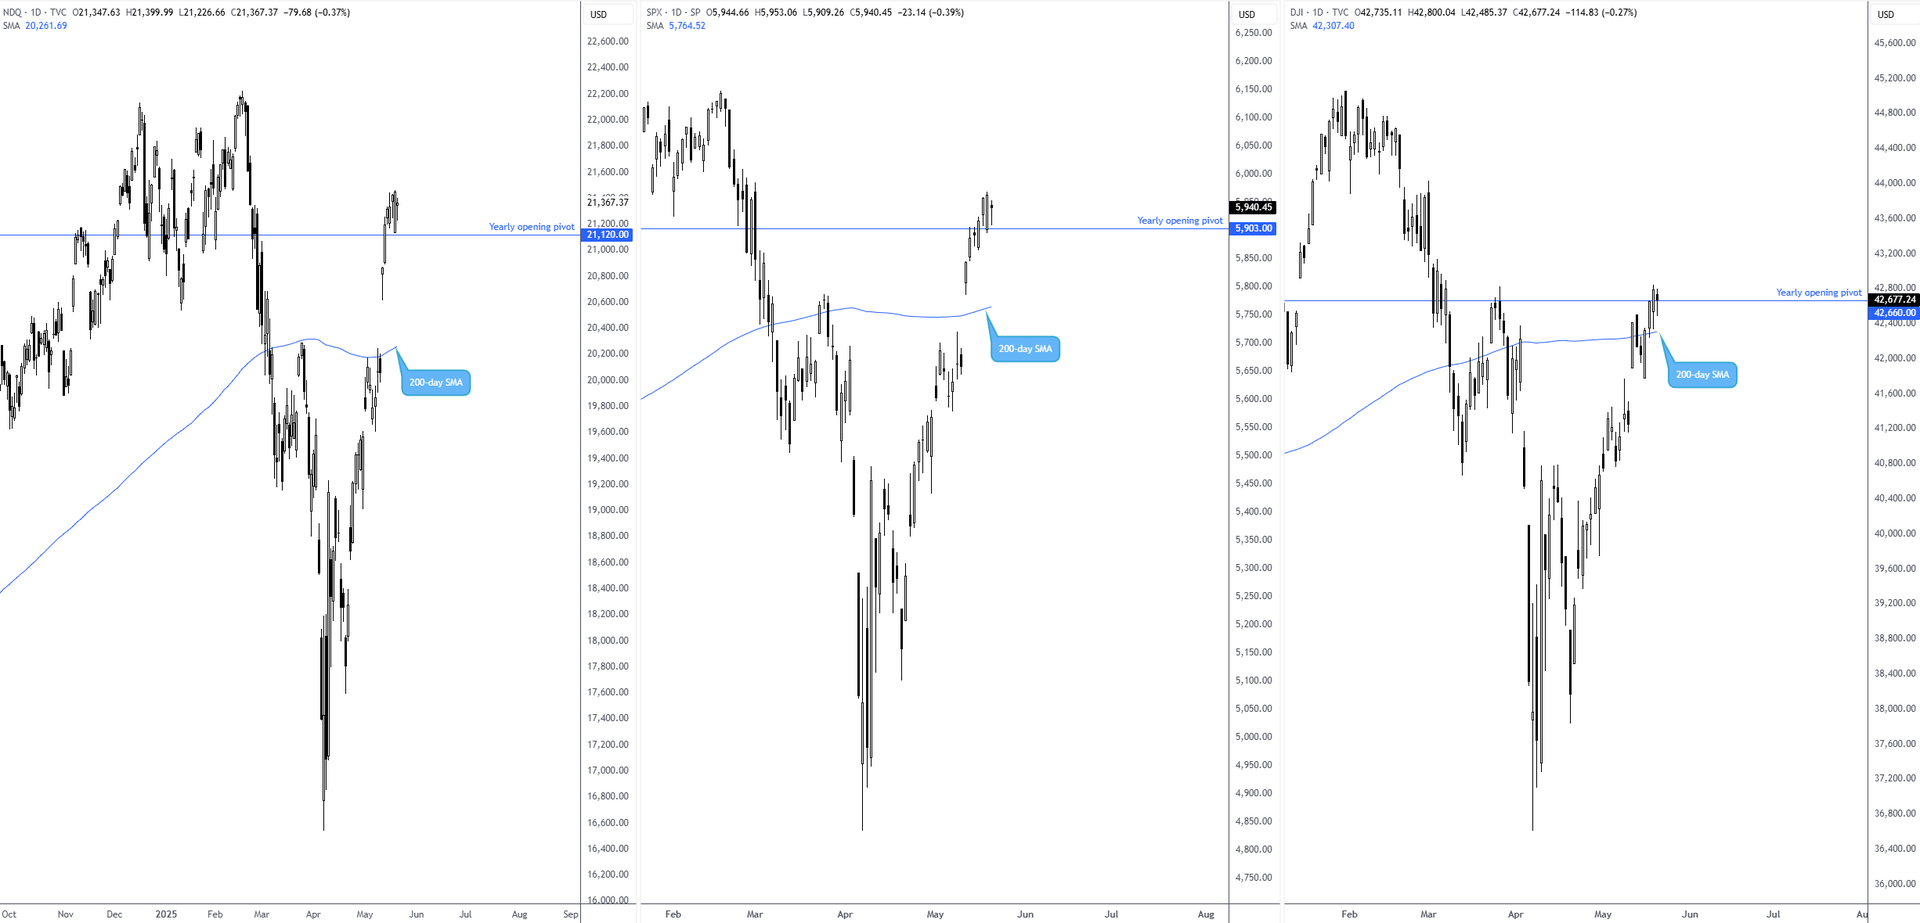
Following the announcement of the 90-day US-China trade truce, US equity markets have outperformed. This has pulled major US equity benchmarks north of the 200-day simple moving averages (SMAs) and seen price manoeuvre into positive territory.
Given the above, despite yesterday’s bearish harami candlestick patterns, the yearly opening pivot levels will likely be closely monitored as support.
Equities: US equity indexes hovering north of 200-day SMAs
Daily timeframe:
Following the announcement of the 90-day US-China trade truce, US equity markets have outperformed. This has pulled major US equity benchmarks north of the 200-day simple moving averages (SMAs) and seen price manoeuvre into positive territory.
Given the above, despite yesterday’s bearish harami candlestick patterns, the yearly opening pivot levels will likely be closely monitored as support.
 Cryptocurrency: Trendline support for SOL/USD
Daily Timeframe:
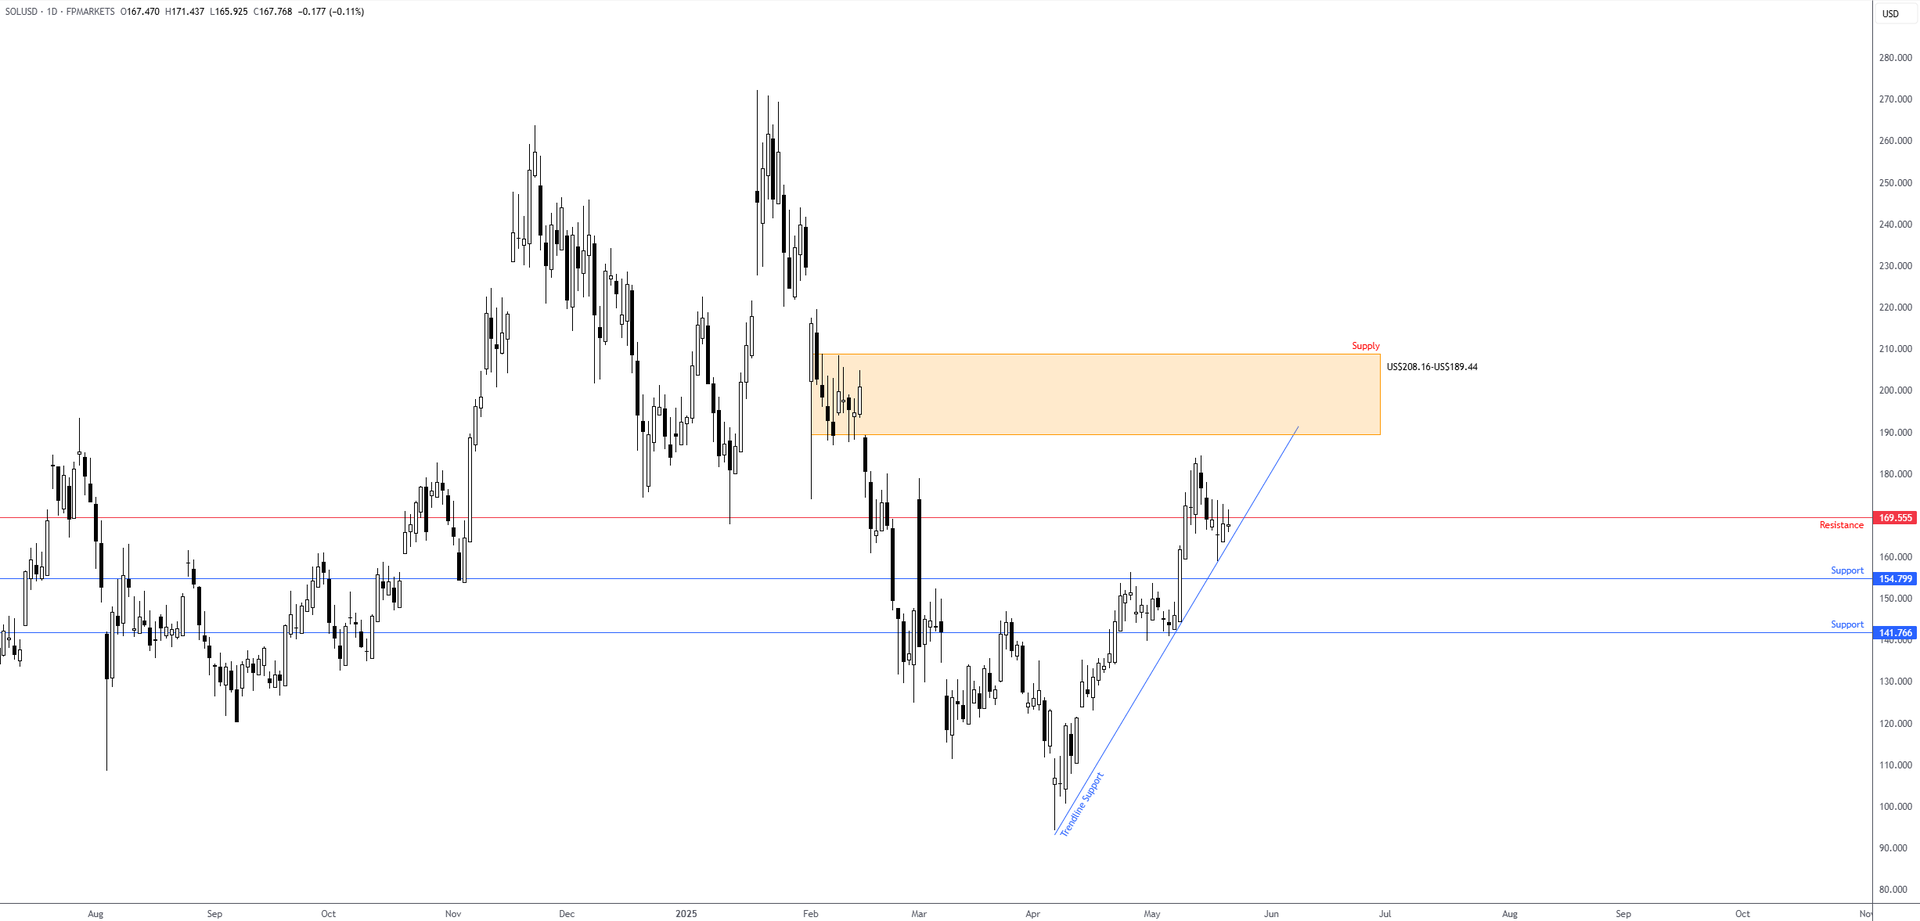
There is no denying that SOL/USD (Solana versus the US dollar) is in the early stages of an uptrend and has recently shaken hands with trendline support, extended from the low of US$94.30. Given this, and the lack of selling pressure evident at the current resistance of US$169.55, a breakout higher could be on the table, targeting supply between US$208.16 and US$189.44.
Cryptocurrency: Trendline support for SOL/USD
Daily Timeframe:
There is no denying that SOL/USD (Solana versus the US dollar) is in the early stages of an uptrend and has recently shaken hands with trendline support, extended from the low of US$94.30. Given this, and the lack of selling pressure evident at the current resistance of US$169.55, a breakout higher could be on the table, targeting supply between US$208.16 and US$189.44.
 Charts created using TradingView
Written by FP Markets Chief Market Analyst Aaron Hill
Charts created using TradingView
Written by FP Markets Chief Market Analyst Aaron HillPublication date:
2025-05-21 11:31:22 (GMT)