Gold Dips as Equities Plunge; Oil Hit by Demand Fears
 Market Recap
Gold retreated sharply as profit-taking surged following a broad stock market sell-off. Prices briefly hit a one-week low of $2,880.19 per ounce before closing at $2,889.33, falling below the key $2,900 level. Meanwhile, oil prices declined more than 1% as concerns grew over US trade policies slowing global economic growth and dampening energy demand.
Gold Overview
Gold tumbled on Monday as a wave of profit-taking followed a sharp drop in US equities. Prices briefly dipped to $2,880.19 per ounce, marking a one-week low. At the close, spot gold was down 0.74%, settling at $2,889.33 per ounce.
The US stock market plummeted as trade policy uncertainty weighed on sentiment. Over the weekend, President Donald Trump did not rule out the possibility that his tariff policies could push the US economy into recession. On Monday, the S&P 500 extended its pullback from last month’s peak, while the Nasdaq plunged 4%, marking its biggest single-day loss since September 2022. The stock market turmoil triggered a shift in investor sentiment, leading some gold bulls to take profits.
On the geopolitical front, Ukrainian President Volodymyr Zelensky met with Saudi Crown Prince Mohammed bin Salman ahead of key US-Ukraine negotiations. Additionally, US Middle East envoy Steve Witkoff said on March 10 that the upcoming US-Ukraine peace talks could achieve substantial progress, further easing safe-haven demand for gold.
Jim Wyckoff, senior analyst at Kitco Metals, commented:
“Gold faced some profit-taking pressure due to weak equities, but safe-haven buying may re-emerge in the coming sessions.”
Gold – Technical Outlook
Gold faced strong resistance at $2,918, triggering a broad sell-off. Prices broke below the key $2,900 support level, with intraday rebounds failing to regain strength. As a result, gold closed near $2,885, forming a bearish candle on the daily chart. The metal has now fallen below its 5-day moving average, signaling a potential shift toward a short-term downtrend.
Market Recap
Gold retreated sharply as profit-taking surged following a broad stock market sell-off. Prices briefly hit a one-week low of $2,880.19 per ounce before closing at $2,889.33, falling below the key $2,900 level. Meanwhile, oil prices declined more than 1% as concerns grew over US trade policies slowing global economic growth and dampening energy demand.
Gold Overview
Gold tumbled on Monday as a wave of profit-taking followed a sharp drop in US equities. Prices briefly dipped to $2,880.19 per ounce, marking a one-week low. At the close, spot gold was down 0.74%, settling at $2,889.33 per ounce.
The US stock market plummeted as trade policy uncertainty weighed on sentiment. Over the weekend, President Donald Trump did not rule out the possibility that his tariff policies could push the US economy into recession. On Monday, the S&P 500 extended its pullback from last month’s peak, while the Nasdaq plunged 4%, marking its biggest single-day loss since September 2022. The stock market turmoil triggered a shift in investor sentiment, leading some gold bulls to take profits.
On the geopolitical front, Ukrainian President Volodymyr Zelensky met with Saudi Crown Prince Mohammed bin Salman ahead of key US-Ukraine negotiations. Additionally, US Middle East envoy Steve Witkoff said on March 10 that the upcoming US-Ukraine peace talks could achieve substantial progress, further easing safe-haven demand for gold.
Jim Wyckoff, senior analyst at Kitco Metals, commented:
“Gold faced some profit-taking pressure due to weak equities, but safe-haven buying may re-emerge in the coming sessions.”
Gold – Technical Outlook
Gold faced strong resistance at $2,918, triggering a broad sell-off. Prices broke below the key $2,900 support level, with intraday rebounds failing to regain strength. As a result, gold closed near $2,885, forming a bearish candle on the daily chart. The metal has now fallen below its 5-day moving average, signaling a potential shift toward a short-term downtrend.
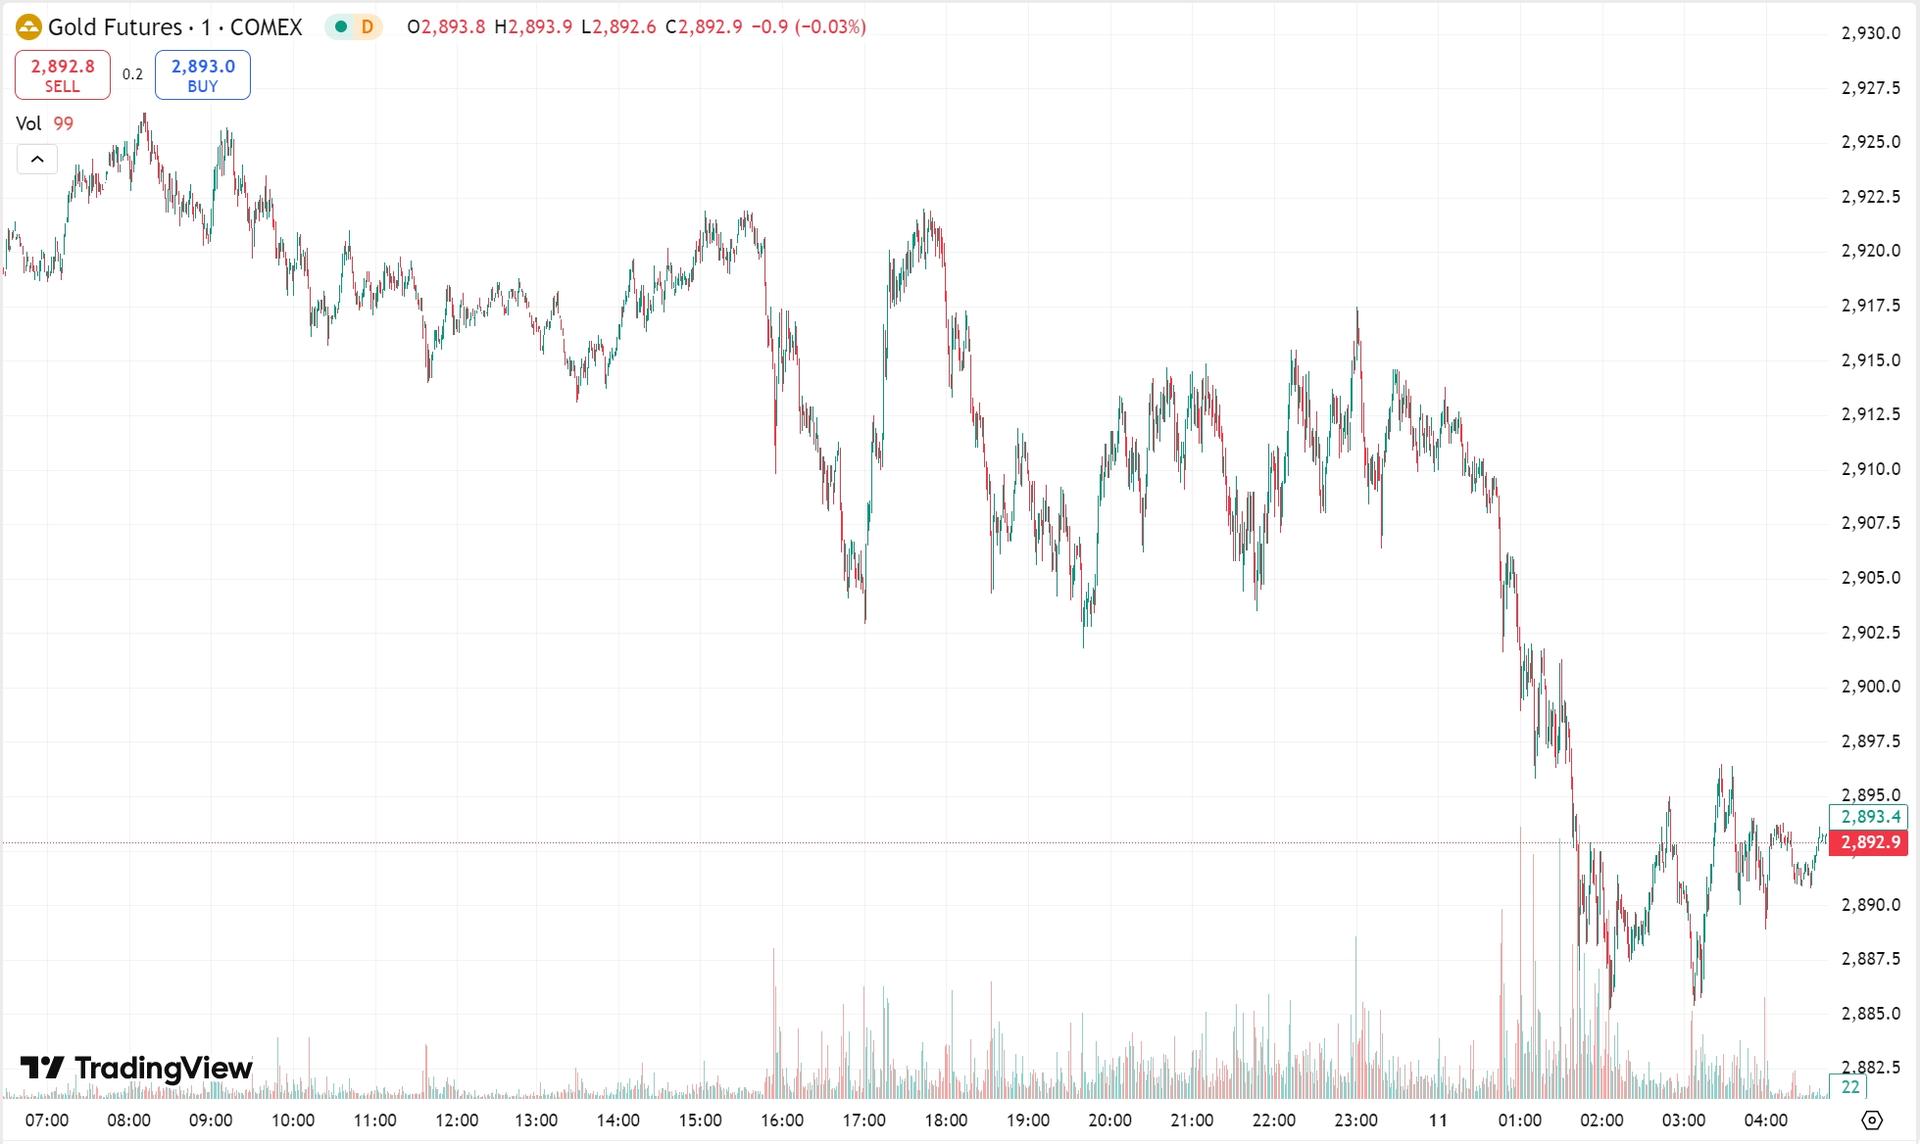 Gold – Key Levels to Watch
- Resistance: $2,895–$2,900
- Support: $2,868–$2,863
Oil Overview
Oil prices dropped as mounting concerns over US tariff policies and weaker global demand pressured energy markets. At the close:
- WTI crude (April contract) fell $1.01 (-1.5%) to $66.03 per barrel
- Brent crude (May contract) lost $1.08 (-1.53%) to $69.28 per barrel
Trump’s aggressive tariff measures and OPEC+’s planned production increase in April continued to weigh on oil prices. Last week, US crude futures posted their seventh consecutive weekly loss, the longest losing streak since November 2023, while Brent crude declined for the third straight week.
John Kilduff, partner at Again Capital, commented:
“The oil market is extremely fragile right now, with traders struggling to gauge macroeconomic risks. Growing fears of a US recession are adding to the uncertainty.”
Meanwhile, US Energy Secretary Chris Wright hinted at a possible tariff exemption for Canadian oil and gas imports. Wright stated that while an agreement “is possible,” negotiations are still ongoing between the US, Canada, and Mexico.
Oil – Technical Outlook
WTI crude tested resistance at $67.60 before reversing lower, breaking below $66.00 and hitting an intraday low of $65.00. The sharp decline reinforced a bearish trend, with technical indicators pointing to further downside momentum.
Gold – Key Levels to Watch
- Resistance: $2,895–$2,900
- Support: $2,868–$2,863
Oil Overview
Oil prices dropped as mounting concerns over US tariff policies and weaker global demand pressured energy markets. At the close:
- WTI crude (April contract) fell $1.01 (-1.5%) to $66.03 per barrel
- Brent crude (May contract) lost $1.08 (-1.53%) to $69.28 per barrel
Trump’s aggressive tariff measures and OPEC+’s planned production increase in April continued to weigh on oil prices. Last week, US crude futures posted their seventh consecutive weekly loss, the longest losing streak since November 2023, while Brent crude declined for the third straight week.
John Kilduff, partner at Again Capital, commented:
“The oil market is extremely fragile right now, with traders struggling to gauge macroeconomic risks. Growing fears of a US recession are adding to the uncertainty.”
Meanwhile, US Energy Secretary Chris Wright hinted at a possible tariff exemption for Canadian oil and gas imports. Wright stated that while an agreement “is possible,” negotiations are still ongoing between the US, Canada, and Mexico.
Oil – Technical Outlook
WTI crude tested resistance at $67.60 before reversing lower, breaking below $66.00 and hitting an intraday low of $65.00. The sharp decline reinforced a bearish trend, with technical indicators pointing to further downside momentum.
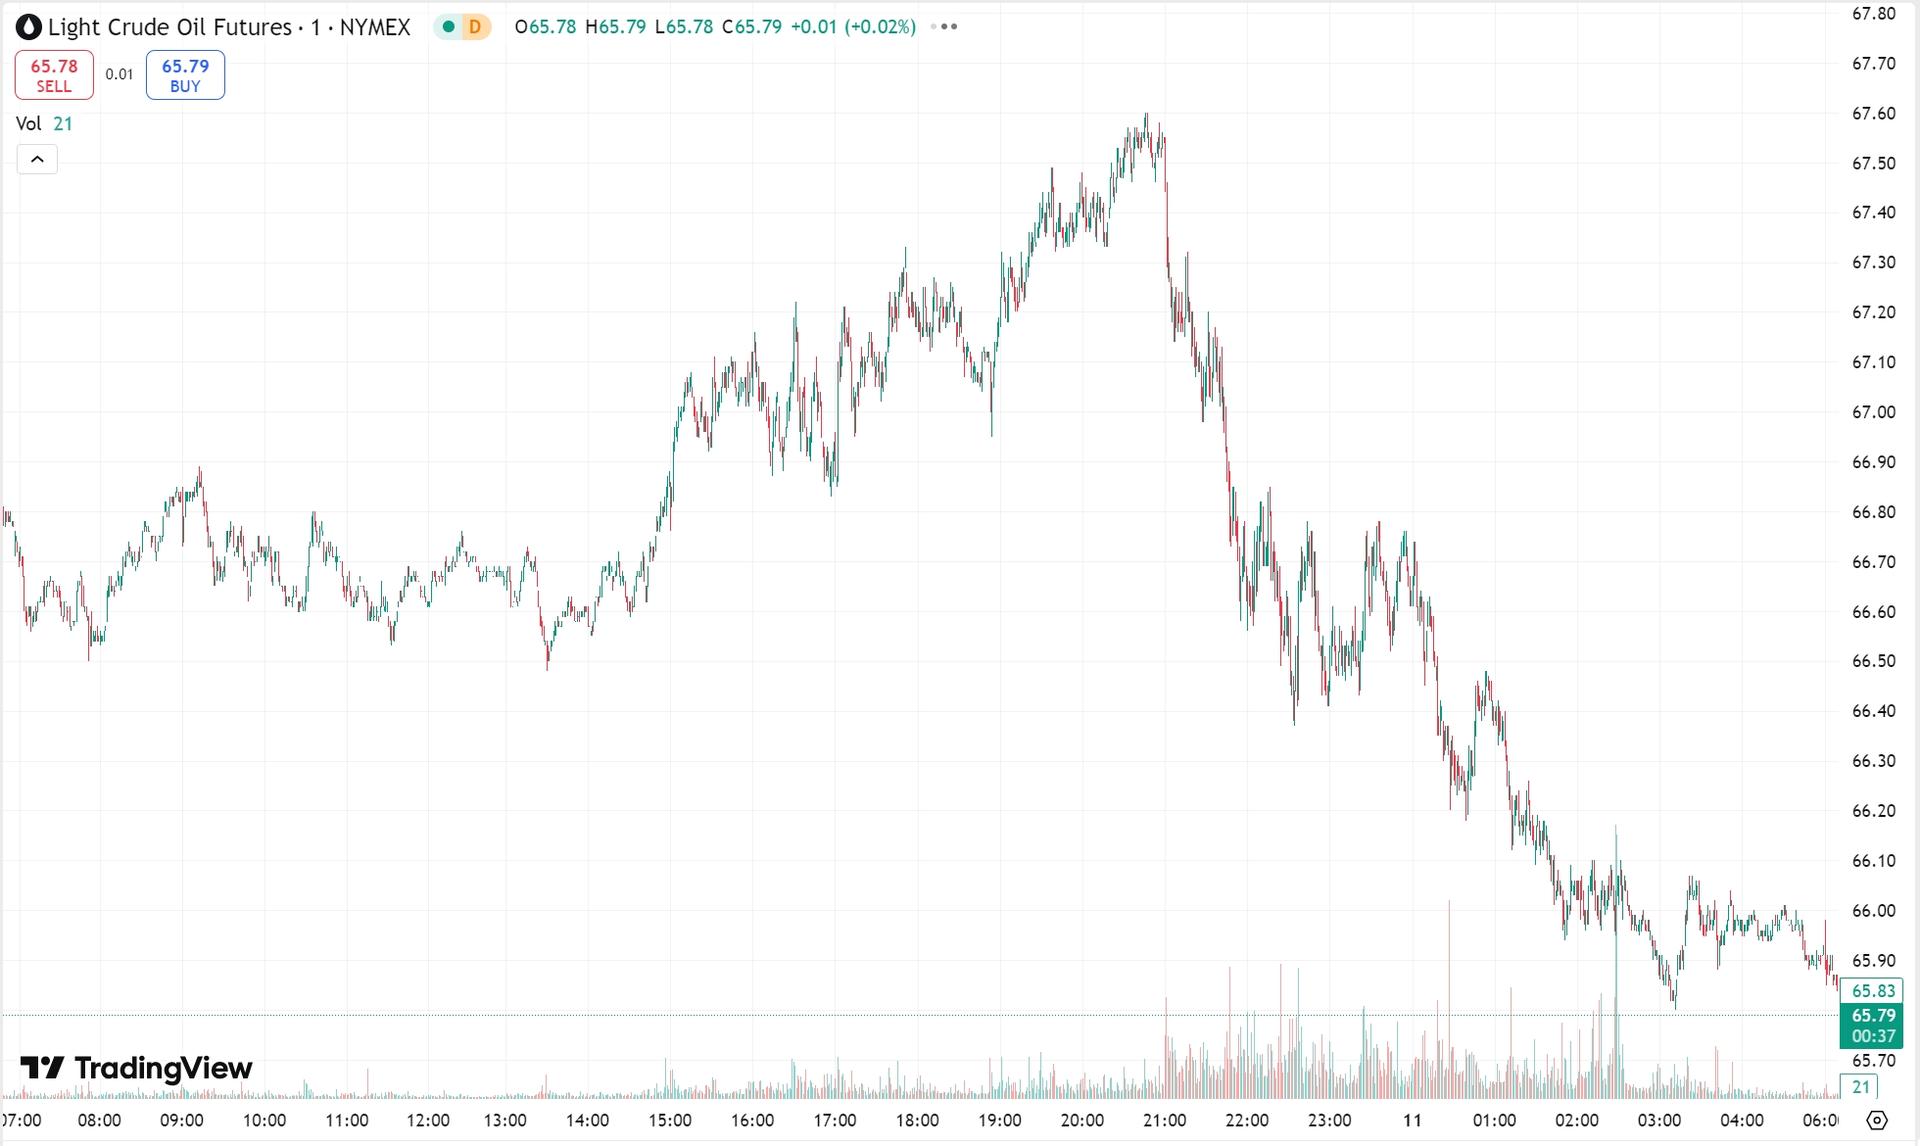 Oil – Key Levels to Watch
- Resistance: $66.80–$67.30
- Support: $64.50–$64.00
Oil – Key Levels to Watch
- Resistance: $66.80–$67.30
- Support: $64.50–$64.00Disclaimer:
This information contained in this blog is for general reference only and is not intended as investment advice, a recommendation, an offer, or an invitation to buy or sell any financial instruments. It does not consider any specific recipient’s investment objectives or financial situation. Past performance references are not reliable indicators of future performance. Doo Prime and its affiliates make no representations or warranties about the accuracy or completeness of this information and accept no liability for any losses or damages resulting from its use or from any investments made based on it.
Publication date:
2025-03-11 13:30:03 (GMT)