Gold and Silver Investment: Will the safe-haven demand hold?
 Gold is on fire, and silver isn’t far behind. With global trade tensions rising, precious metals are cashing in on market uncertainty, proving why they remain the ultimate haven investments.
The tariff earthquake and its ripple effects
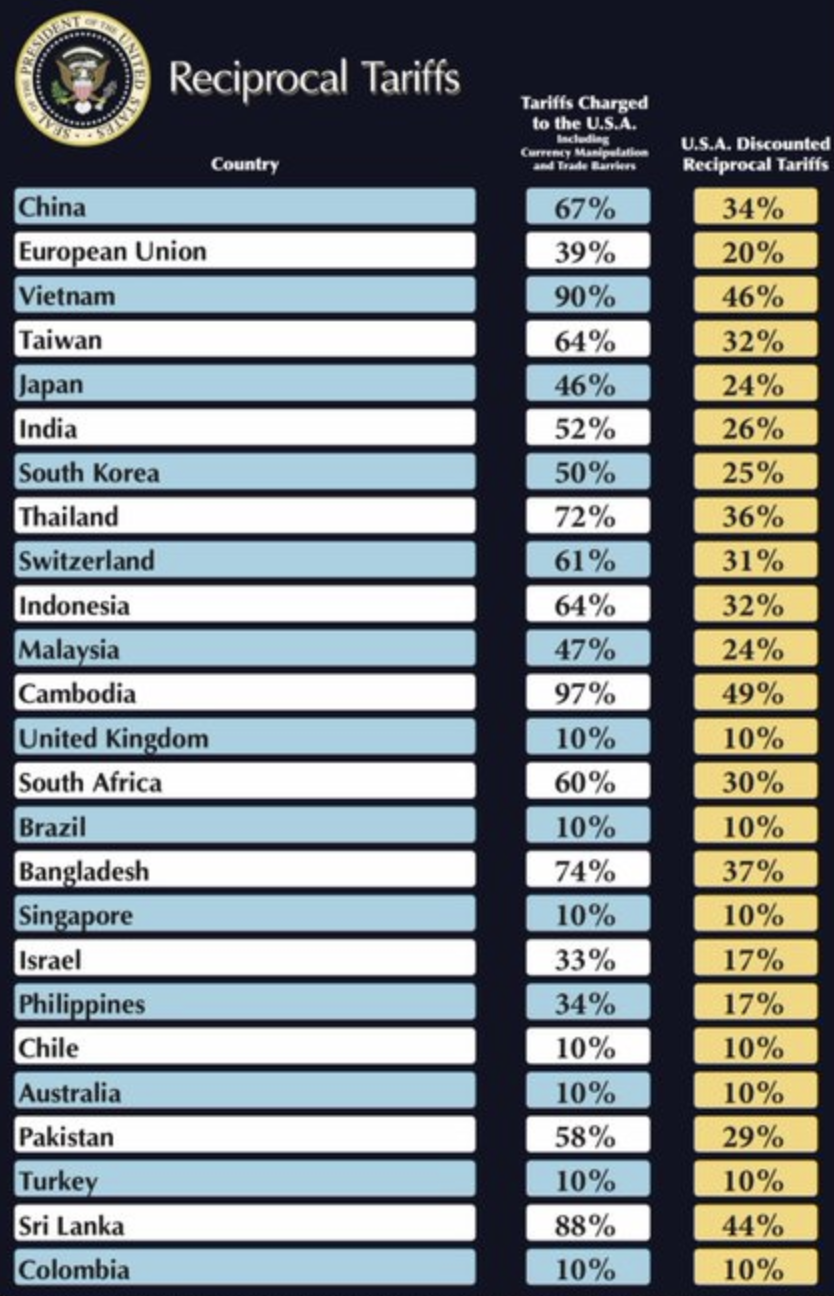
Recent trade policy shifts have sent shockwaves through the global economy. On what’s now being called "US Liberation Day," President Trump announced sweeping new tariffs: a 10% baseline on all imports, 25% on automobiles, and steeper reciprocal tariffs hitting China (34%), the EU (20%), Vietnam (46%), Japan (24%), and the UK (10%).
Gold is on fire, and silver isn’t far behind. With global trade tensions rising, precious metals are cashing in on market uncertainty, proving why they remain the ultimate haven investments.
The tariff earthquake and its ripple effects
Recent trade policy shifts have sent shockwaves through the global economy. On what’s now being called "US Liberation Day," President Trump announced sweeping new tariffs: a 10% baseline on all imports, 25% on automobiles, and steeper reciprocal tariffs hitting China (34%), the EU (20%), Vietnam (46%), Japan (24%), and the UK (10%).
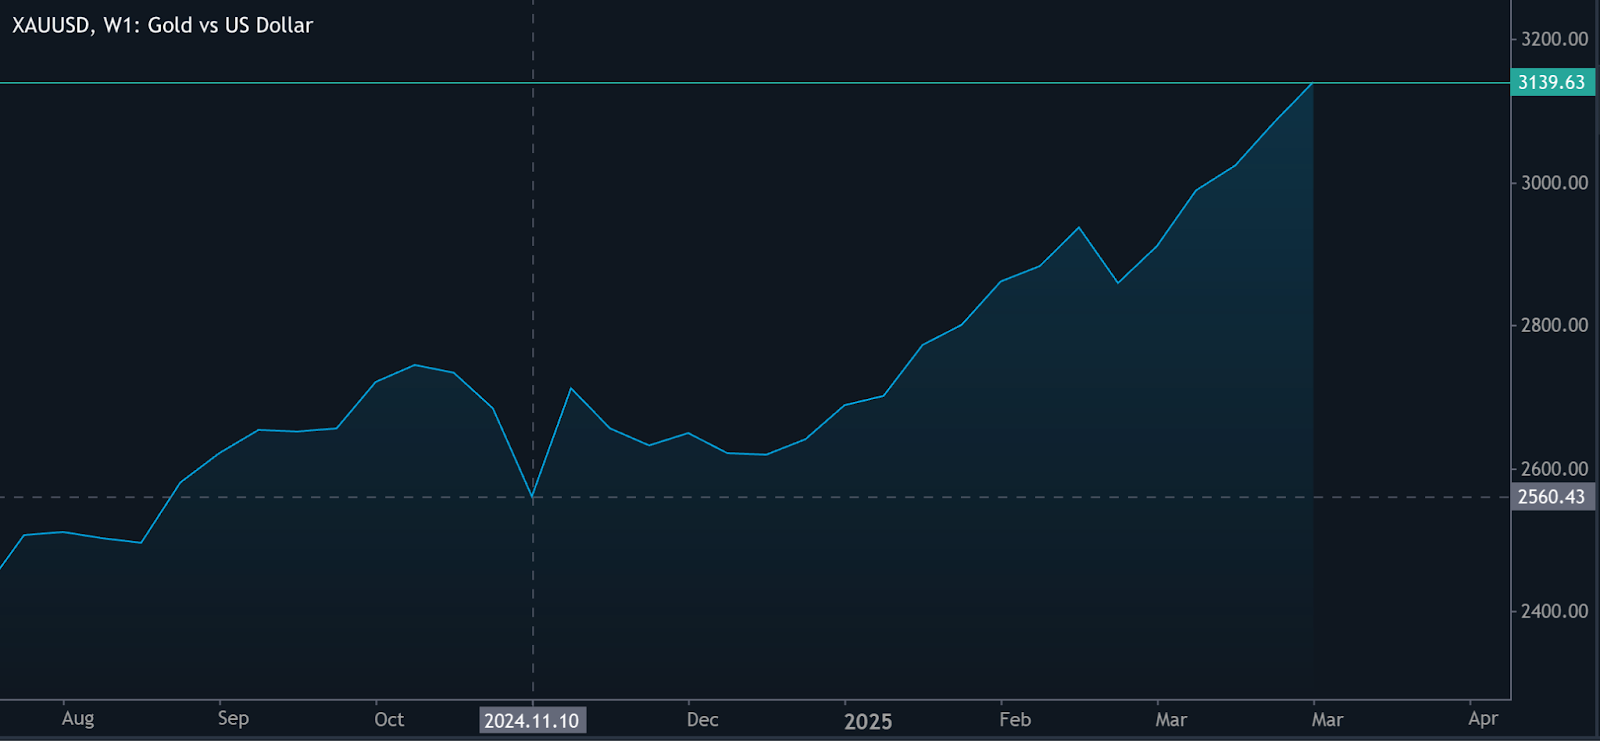
 Markets reacted swiftly. The U.S. dollar slipped, stocks wobbled, and gold surged past $3,100, with $3,200 now the next target. Since Trump’s election win, gold has gained over 23%, climbing from a low of $2,560 in mid-November to its current high.
 Analyst Tai Wong notes that these tariffs are "much more aggressive than expected," fueling volatility and increasing demand for safe-haven assets.
Safe havens in demand
Whenever economic uncertainty spikes, investors instinctively flock to gold and silver. Gold’s resilience is particularly striking. Typically, rising U.S. Treasury yields would weigh on non-yielding assets like gold. But this time, fear and inflation concerns are overriding traditional market dynamics, according to analysts.
Often overshadowed by gold, silver is making its case for a breakout. It recently touched $34 before a significant pullback. Time will tell whether the current pullback will attract enough dip buyers to push the white metal to new highs.
The Fed’s dilemma
Adding to the intrigue, the Federal Reserve is now facing a challenging crossroads. The latest economic data shows strength. ADP reported that private-sector hiring jumped to 155K in March, well above February’s 84K.
Factory orders rose 0.6% month-over-month, slightly above expectations. These numbers suggest the economy remains resilient despite looming trade tensions.
image:https://d15k2d11r6t6rl.cloudfront.net/pub/bfra/ewej41oi/c4s/c65/evu/67ee4a9bfc9a6df485ac973e_AD_4nXc-7Mc50--ytFiksSQkWd6r7Oi1UMIfilHhevKdyyMK40l3xb25YlJWml7T5phkSBAapSR5Sb0SHkmQsp-5GyoY1bmGSq_o3kSjCo186_DPPB47Q8vfrBjnilDsTGSuN5jIznOz.png]
Source: US Census Bureau
However, inflation pressures are rising. Trump’s tariffs are expected to push prices higher, making it difficult for the Fed to justify rate cuts. On the other hand, hiking rates won't be a viable option if economic growth slows due to a prolonged trade war. This policy limbo creates an ideal environment for metals, which tend to thrive when traditional financial tools lose effectiveness.
A long-term metals outlook
Gold and silver aren’t just reacting to recent trade tensions-they reflect deeper concerns about global economic stability. With tariffs threatening to reshape international trade and monetary policy at a crossroads, investors increasingly turn to precious metals as a hedge against uncertainty. Whether this turns into a full-fledged metals bull market remains to be seen, but one thing is clear: silver is back in the spotlight.
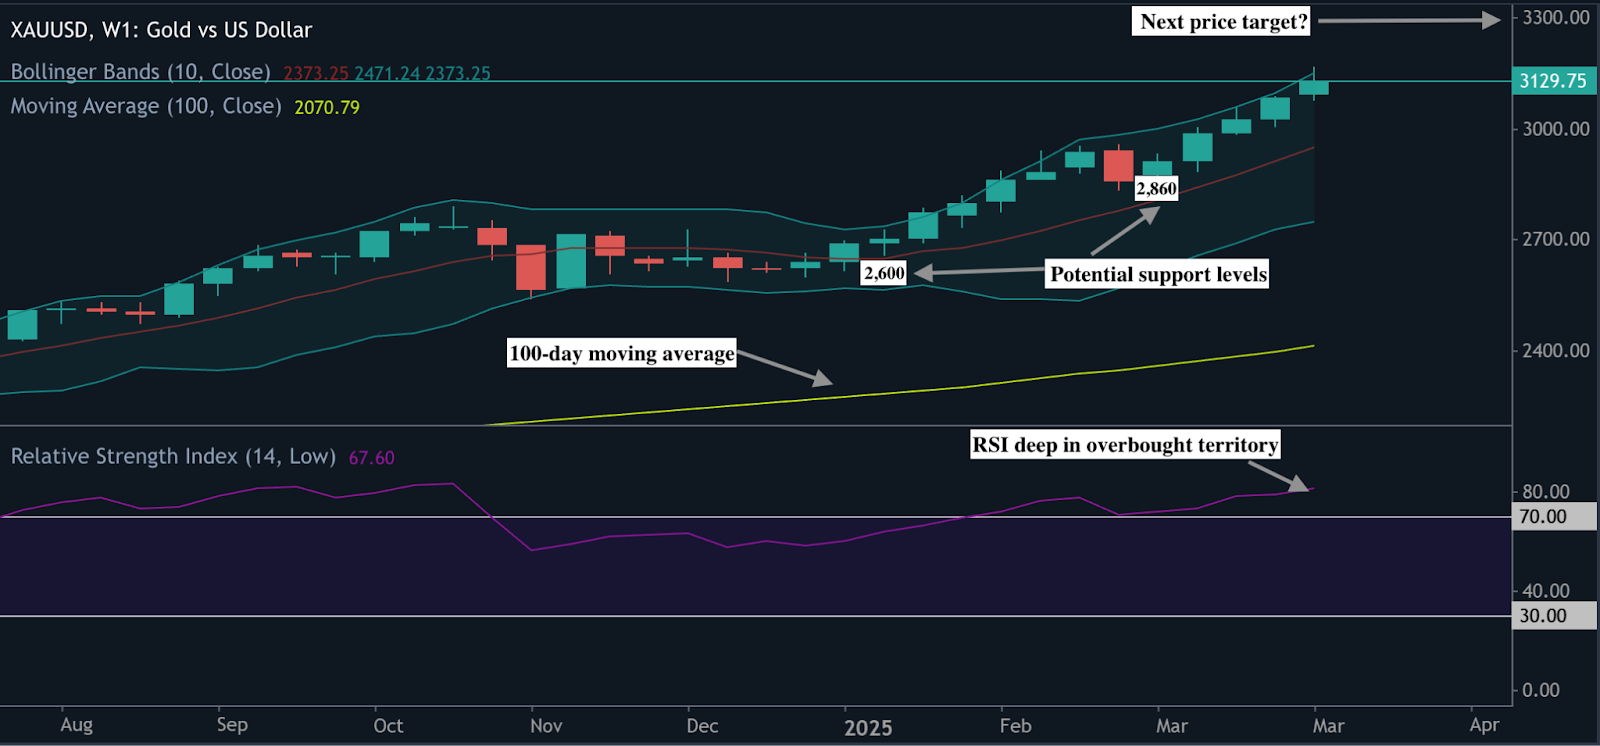
Gold sees a slight retreat at the time of writing, though upside pressure remains dominant. Prices remaining elevated above the 100-day moving average add to upside sentiment. However, RSI deep in overbought levels, while prices touch the upper Bollinger band, paints a picture of overbought conditions.
Key levels to watch should prices retreat are $2,860 and $2,600, should prices remain on a tear, the next target could be $3,300.
Analyst Tai Wong notes that these tariffs are "much more aggressive than expected," fueling volatility and increasing demand for safe-haven assets.
Safe havens in demand
Whenever economic uncertainty spikes, investors instinctively flock to gold and silver. Gold’s resilience is particularly striking. Typically, rising U.S. Treasury yields would weigh on non-yielding assets like gold. But this time, fear and inflation concerns are overriding traditional market dynamics, according to analysts.
Often overshadowed by gold, silver is making its case for a breakout. It recently touched $34 before a significant pullback. Time will tell whether the current pullback will attract enough dip buyers to push the white metal to new highs.
The Fed’s dilemma
Adding to the intrigue, the Federal Reserve is now facing a challenging crossroads. The latest economic data shows strength. ADP reported that private-sector hiring jumped to 155K in March, well above February’s 84K.
Factory orders rose 0.6% month-over-month, slightly above expectations. These numbers suggest the economy remains resilient despite looming trade tensions.
image:https://d15k2d11r6t6rl.cloudfront.net/pub/bfra/ewej41oi/c4s/c65/evu/67ee4a9bfc9a6df485ac973e_AD_4nXc-7Mc50--ytFiksSQkWd6r7Oi1UMIfilHhevKdyyMK40l3xb25YlJWml7T5phkSBAapSR5Sb0SHkmQsp-5GyoY1bmGSq_o3kSjCo186_DPPB47Q8vfrBjnilDsTGSuN5jIznOz.png]
Source: US Census Bureau
However, inflation pressures are rising. Trump’s tariffs are expected to push prices higher, making it difficult for the Fed to justify rate cuts. On the other hand, hiking rates won't be a viable option if economic growth slows due to a prolonged trade war. This policy limbo creates an ideal environment for metals, which tend to thrive when traditional financial tools lose effectiveness.
A long-term metals outlook
Gold and silver aren’t just reacting to recent trade tensions-they reflect deeper concerns about global economic stability. With tariffs threatening to reshape international trade and monetary policy at a crossroads, investors increasingly turn to precious metals as a hedge against uncertainty. Whether this turns into a full-fledged metals bull market remains to be seen, but one thing is clear: silver is back in the spotlight.
Gold sees a slight retreat at the time of writing, though upside pressure remains dominant. Prices remaining elevated above the 100-day moving average add to upside sentiment. However, RSI deep in overbought levels, while prices touch the upper Bollinger band, paints a picture of overbought conditions.
Key levels to watch should prices retreat are $2,860 and $2,600, should prices remain on a tear, the next target could be $3,300.
 Source: Deriv MT5
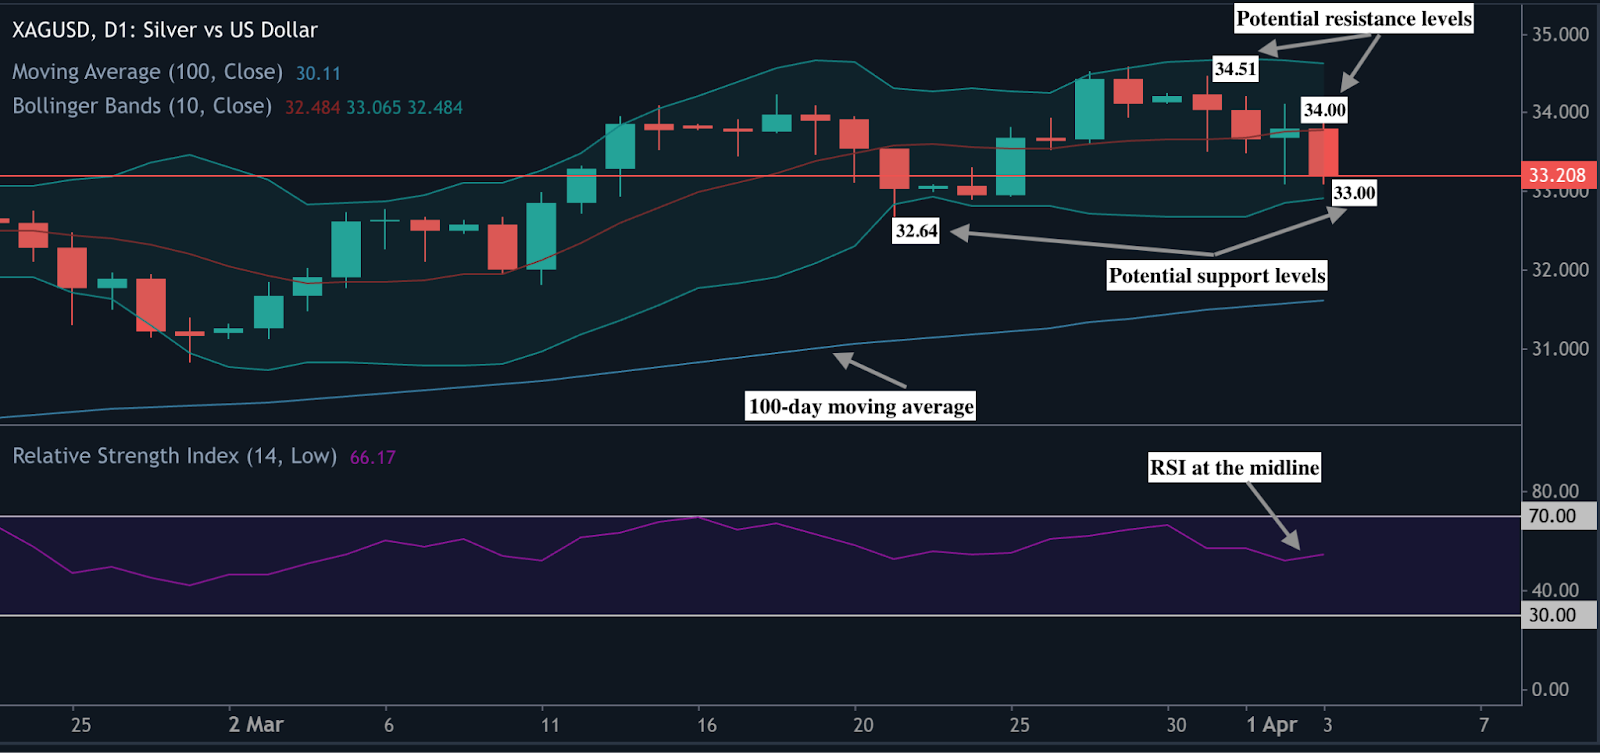
Conversely, Silver is seeing a significant retreat as the RSI holds almost flat around the midline, an indicator that upside momentum is waning. However, prices nearly touching the lower Bollinger band hint at oversold conditions. Prices above the 100-day moving average also suggest that the main trend is still upward.
Should prices continue retreating, key levels to watch are $33.00 and $32.64. They could touch the $34.00 and $34.51 resistance levels if prices rebound.
Source: Deriv MT5
Conversely, Silver is seeing a significant retreat as the RSI holds almost flat around the midline, an indicator that upside momentum is waning. However, prices nearly touching the lower Bollinger band hint at oversold conditions. Prices above the 100-day moving average also suggest that the main trend is still upward.
Should prices continue retreating, key levels to watch are $33.00 and $32.64. They could touch the $34.00 and $34.51 resistance levels if prices rebound.
 Source: Deriv MT5
lt text: A silver price chart from Deriv MT5 displaying key technical indicators, showing potential support and resistance levels.
Source: Deriv MT5
Source: Deriv MT5
lt text: A silver price chart from Deriv MT5 displaying key technical indicators, showing potential support and resistance levels.
Source: Deriv MT5Disclaimer:
The information contained within this article is for educational purposes only and is not intended as financial or investment advice. It is considered accurate and correct at the date of publication. Changes in circumstances after the time of publication may impact the accuracy of the information. The performance figures quoted refer to the past, and past performance is not a guarantee of future performance or a reliable guide to future performance. No representation or warranty is given as to the accuracy or completeness of this information. Do your own research before making any trading decisions.
Publication date:
2025-04-03 10:46:57 (GMT)